Paniolo
Newbie level 2
I have built a small, lightweight pontoon boat that uses an electric trolling motor as the sole means of locomotion drawing power from a single, solar-charged marine battery. The electrical system is as follows: two 135W solar modules are wired in parallel then wired (input) into a charge controller; the charge controller is also wired (output) to a 12V 75Ah marine battery; the 12V DC motor is also wired to the battery.
I need to first create simplified Simulink models of the battery, the PV solar array, the charge controller, and the motor. Then, I would like to create a Simulink circuit that first models these components as integrated in real life. The Matlab Simulink circuit I am trying to emulate is found here: https://www.mathworks.com/help/physmod/sps/powersys/ref/battery.html This is much more sophisticated than I need--I simply want to build a circuit in which I can insert or use the empirical data I have gathered from experiments. Ultimately, I'd like this Simulink model to reasonably predict how long the battery will last given a certain amp-draw from the motor while accounting for the input from the PV array. I would like to use data that I have gathered in the Simulink model to validate it.
I have all the data and specs on the components, so I can provide some more of that if it helps clarify my query. Here is some of the data I have gathered:
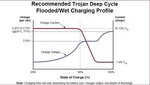
-I used a digitally controlled battery analyzer to discharge the fully charged battery at a constant 3.75A. I considered 10.5V as fully discharged per manufacturer specifications. I then fully charged this battery using an automatic battery charger (not the charge controller) with approximately 40A. Both of these graphs are uploaded. I would like to build a circuit that recreates these two curves--the discharge and recharge.
-I also submerged the trolling motor in a large bin of water and ran it non-stop for over 8 hours. The solar-array was able to fully charge the battery while the motor simultaneously discharged the battery. Per the manufacturer, the motor draws 55A per hour at full speed. The experiment was run with the motor at a constant half speed, but the actual amp-draw at this speed is unclear.
Again, I am trying to emulate the generic power_battery exampled cited above from the Mathworks.
Any suggestions?


I need to first create simplified Simulink models of the battery, the PV solar array, the charge controller, and the motor. Then, I would like to create a Simulink circuit that first models these components as integrated in real life. The Matlab Simulink circuit I am trying to emulate is found here: https://www.mathworks.com/help/physmod/sps/powersys/ref/battery.html This is much more sophisticated than I need--I simply want to build a circuit in which I can insert or use the empirical data I have gathered from experiments. Ultimately, I'd like this Simulink model to reasonably predict how long the battery will last given a certain amp-draw from the motor while accounting for the input from the PV array. I would like to use data that I have gathered in the Simulink model to validate it.
I have all the data and specs on the components, so I can provide some more of that if it helps clarify my query. Here is some of the data I have gathered:
-I used a digitally controlled battery analyzer to discharge the fully charged battery at a constant 3.75A. I considered 10.5V as fully discharged per manufacturer specifications. I then fully charged this battery using an automatic battery charger (not the charge controller) with approximately 40A. Both of these graphs are uploaded. I would like to build a circuit that recreates these two curves--the discharge and recharge.
-I also submerged the trolling motor in a large bin of water and ran it non-stop for over 8 hours. The solar-array was able to fully charge the battery while the motor simultaneously discharged the battery. Per the manufacturer, the motor draws 55A per hour at full speed. The experiment was run with the motor at a constant half speed, but the actual amp-draw at this speed is unclear.
Again, I am trying to emulate the generic power_battery exampled cited above from the Mathworks.
Any suggestions?