Continue to Site

Welcome to EDAboard.com

Welcome to our site! EDAboard.com is an international Electronics Discussion Forum focused on EDA software, circuits, schematics, books, theory, papers, asic, pld, 8051, DSP, Network, RF, Analog Design, PCB, Service Manuals... and a whole lot more! To participate you need to register. Registration is free. Click here to register now.

Digital moduation & demodulation

Status
Not open for further replies.

thu

Newbie level 4
Joined
May 26, 2008
Messages
7
Helped
1
Reputation
2
Reaction score
1
Trophy points
1,283
Activity points
1,318
If x="10101100",How to sampling and plot s(t),y1(t),y2(t),x1,x2,I need MATLAB code,Thank you very much!
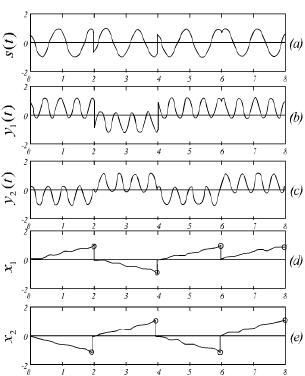
 

signal is:"10101100",I want use QPSK modulation & demodulation to plot this signal use MATLAB code?
about s(t),y1(t),y2(t),x1,x2,
Help~
 

thu said:
If x="10101100",How to sampling and plot s(t),y1(t),y2(t),x1,x2,I need MATLAB code,Thank you very much!

more information we needed.
 

Hi guys.
I am junior communication student,
example:If signal x="10011011"
How use MATLAB code(.m files) to plot this five figure.
12_1212154620.jpg

I am more thanks for you,Thanks again.
 

some more information is needed buddy.
 

Hi guys.
If use QPSK moduation & demodulation,How to plot the results?
 

Anybody give a hand~~~Help~~~
 
  • Like
Reactions: pretha

    pretha

    Points: 2
    Helpful Answer Positive Rating
Status
Not open for further replies.

Similar threads

Part and Inventory Search

Welcome to EDABoard.com

Sponsor

Back
Top