Matata
Newbie level 1
Hello,
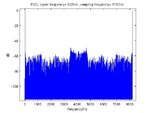
I am trying to implement a behavioral model of a delta modulator in Matlab, consisting of an ideal comparator and a summing unit in the feedback path. Unfortunately the spectrum is not flat as expected and I get peaks at odd harmonics of the signal frequency (cf. attachment).
Does this behavior occur because the quantization noise is not white but correlated or where else does this come from?
Thanks a lot in advance!
Main program:
Deltamodulator:
I am trying to implement a behavioral model of a delta modulator in Matlab, consisting of an ideal comparator and a summing unit in the feedback path. Unfortunately the spectrum is not flat as expected and I get peaks at odd harmonics of the signal frequency (cf. attachment).
Does this behavior occur because the quantization noise is not white but correlated or where else does this come from?
Thanks a lot in advance!
Main program:
Code:
clear all;
close all;
clf;

N=17;              % Number of signal periods per Window
NT=2048;           % Number of samples per signal period
Nfft=N*NT;         % FFT-size (samples per window)


ampl=50;           % signal amplitude
Tsig=0.25;         % signal period in sec
fsig=1/Tsig;       % signal frequency

t0=Tsig/NT;        % sampling period (resolution in time domain)
fs=1/t0            % sampling frequency
T=N*Tsig;          % size of window (time domain)
f0=1/T;            % Resolution in frequency domain

t=[0:Nfft-1]'*t0;  % time vector
f=[0:Nfft-1]'*f0;  % f-Vektor


%------------------------

feedbackgain=1;

pulse=zeros(Nfft,1);
sum_pulses=zeros(Nfft,1);    % reconstructed signal
iloop=zeros(Nfft,1);         % loop current

Iin=ampl*sin(2*pi*fsig*t);   % input current

for i=1:Nfft
   if (i>1)
       iloop(i)=Iin(i)-sum_pulses(i-1)*feedbackgain;
   else
       iloop(i)=Iin(i);
   end
   [pulse(i)]=deltamodulator(iloop(i));
   if (i>1)
       sum_pulses(i)=sum_pulses(i-1)+pulse(i);
   else
       sum_pulses(i)=pulse(i);
   end
end


figure(1)
subplot(311), plot(t,Iin);
title(['Input signal']);

subplot(312), plot(t,iloop);
title(['loop current']);

subplot(313)
plot(t,sum_pulses)
title(['reconstructed signal']);
xlabel(['time/s']);


figure(2)
R=fft(sum_pulses);
Prr=R.*conj(R);
plot(f,10*log10(Prr/max(Prr)));
title(['PSD, signal frequency= ',num2str(Tsig), 'Hz ,sampling frequency= ', num2str(fs),'Hz']);
xlabel(['frequency/Hz']);
ylabel(['dB']);
Deltamodulator:
Code:
function dm=deltamodulator(x)
   if(x>=0)
      pulse=1;
   else
      pulse=-1;
   end
%encoder
dm = pulse;