Continue to Site

Welcome to EDAboard.com

Welcome to our site! EDAboard.com is an international Electronics Discussion Forum focused on EDA software, circuits, schematics, books, theory, papers, asic, pld, 8051, DSP, Network, RF, Analog Design, PCB, Service Manuals... and a whole lot more! To participate you need to register. Registration is free. Click here to register now.

can't debug using ICD3 (ICD3Err0040)

Status
Not open for further replies.

renguo

Newbie level 6
Newbie level 6
Joined
Oct 30, 2012
Messages
14
Helped
1
Reputation
2
Reaction score
1
Trophy points
1,283
Visit site
Activity points
1,416
Hi,

It's my first time to use this debugging feature but I can't seem to make it work. I'm using MPLAB ICD 3 and 16-bit 28-pin demo baord (DM300027) for the dspic33fj16gs502. My configuration bits are as follows:

_FOSCSEL(FNOSC_FRC) // Select Internal FRC
_FOSC(FCKSM_CSECMD & OSCIOFNC_ON) // Select Oscillator I/O function
_FWDT(FWDTEN_OFF) // Disable the Watch Dog Timer
_FPOR(FPWRT_PWR128 ) // Select Power On timer and BOR
_FICD(ICS_PGD1 & JTAGEN_OFF) // Select Debug/Program Lines and JTAG OFF

any ideas? Could it be that my board is broken?

i can program the dspic just fine but when I enter the debugging mode, i get an error message:
Running... ICD3Err0040: The target device is not ready for debugging. Please check your configuration bit settings and program the device before proceeding.

if i program the device via the Programmer button, it programs just fine. But if I program using the Debugger button, it will say Programming/Verify complete but will display the ICD3Err0040 error message when I click Run
 

i've just tried compiling for debug but still doesn't work. same error. i'm using mplab 8.92
 

hey renguo,
I am using ICD3 with MAPLAB X and it works fine. In ICD3, you can choose hardware breakpoints and software breakpoints. My suggestion is to try different options in project configurations and also try ICD3 power supply(via usb) and develop-board power supply.
Ye
 

I've always been using board power supply. I just tried usb supply now and even icd 3 supply but both don't work :(
I also tried mplab x last night, but didn't work as well
 

try this one!
go to
Debugger>ICD3 Settings>Program Memory>Automatically
check the
“Program after successful build”
option
 

please take a just snapshot of MPLAB IDE when u debugging your code. and please give me full configuration setting and some code to resolve your problem.
 

Hi, please see the configuration on my first post. as for the error, it's always the same thing, which is ICD3Err0040: The target device is not ready for debugging. Please check your configuration bit settings and program the device before proceeding.

It compiles and programs just fine, just can't run on debug mode
 

ok when u programing to your hardware that time your hardware is working properly or not?
 

yes, i tried on blinking LED, it works just fine. another weird thing with this board is that I can't seem to use it to program other 28-pin MCUs except for dspic33fj16gs502. I bought pic24 and other dspic33 models but they don't get detected. that's why I'm thinking this board might be malfunctioning.
 

Reviewing the schematics of the development board, I see no indication the board could be "broken" in such a way as to permit programming but not debugging the device.

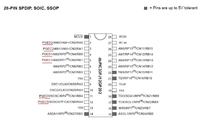
The location/pin number and its associated nomenclature number of the PGCx/EMUCx and PGDx/EMUDx pairs varies from the dsPIC33FJ12GP202 utilized in the example code and your dsPIC33FJ16GS502.

Examine the following pin outs:


Reference:16-Bit 28-Pin Starter Development Board User’s Guide, Section:2.6.2 Selecting the MPLAB ICD 2 Communication Pins, Page 21
For this development board, the pin pairs, PGCx/EMUCx, on device pins 4, 5, 11 and
12 are used for debugging.

Therefore when debugging dsPIC33FJ16GS502 with this development board, it appears the PGC2/EMUC2 and PGD2/EMUD2 on device pins 11 and 12 are your only option.

The ICD3 may not be connected to the correct debug pair, rather than PGC1/EMUC1 and PGD1/EMUD1, try compiling the code with PGC2/EMUC2 and PGD2/EMUD2 selected as the debugging pair.

I suspect this maybe the reason you are having difficulty with the other two devices.

You will need to study the specific device pinout from its datasheet to determine the correct PGCx/EMUCx and PGDx/EMUDx pair and its associated Configuration Register settings.


How have you configured SW2, as "USB/Debug" or is it in "Program" mode when attempting to Debug?

Reference:16-Bit 28-Pin Starter Development Board User’s Guide, Section:2.6.2 Selecting the MPLAB ICD 2 Communication Pins, Page 21
Note: SW2 must be switched to the “Program” position for dsPIC30F devices
when the application is being programmed into a device with MPLAB ICD 2.
Once programming is complete, SW2 must be switched back to the
“USB/Debug” position for UART communication via the USB bridge. See
Figure 4-1 for the location of this switch.

I must admit the Microchip documentation and schematic for the board is rather unclear as to the purpose and proper configuration of SW2 and its relationship with the ICSP connector/lines, the onboard PIC18F2450 and the PGCx/EMUCx and PGDx/EMUDx device pins.

You may need to breakout the multimeter and determine the exact connections of the ICSP connector/lines to device pins and any role of the SW2 switch.


I would also recommend powering the board/device with either the USB or 9V barrel connector, rather than attempt to power it with the ICD3.


BigDog
 
  • Like
Reactions: renguo

    renguo

    Points: 2
    Helpful Answer Positive Rating
omg, thanks a lot! It worked now using PGC2/EMUC2. I admit I never really paid much attention to config bits. I have been making fairly easy projects before my current project, so I did not need to use the debug mode before. And it just worked so I never bothered, lol. I don't have time to test other devices but I think they will work now using the right config bits. THANK YOU!

- - - Updated - - -

How have you configured SW2, as "USB/Debug" or is it in "Program" mode when attempting to Debug?

The manual says Program mode is used only for dspic30f devices. I've never used them so I just keep it on USB/Debug mode
 

ok, another question. I have just started debugging but the part I want to see most is in the ISR which triggers the ADC using PWM special event trigger. But while running in debug mode (Step Into or Animate), it keeps looping around the while loop and never enters ISR.

Is this some sort of limitation with the debug mode? Or is it still possible using some special settings? I know this might be written somewhere in the manuals but I have no idea where to start. I can't seem to find some explanation on google also. Please point me to the right direction. Thanks!

- - - Updated - - -

another strange thing: when I click the Run button, it shows me the following message:

Running... Target halted

Any ideas what could be the problem?
 
Last edited:

another strange thing: when I click the Run button, it shows me the following message:

Running... Target halted

Any ideas what could be the problem?

Without reviewing your code it is difficult to offer meaningful advice.

Please post your code using either CODE or SYNTAX tags, so that we can examine it.

One possible issue is the lack of a Super Loop structure, i.e., an infinite loop which prevents code execution from exiting your application.

Unlike application written for platforms with an underlying OS, many embedded platforms lack any OS to which code execution can resume once it exits your application.

Which is why you typically see the following code structure or similar technique employing in embedded applications:

Code:
while(1)
{
   //possible sleep or dummy statement
}

Code execution is held within the Super Loop until an interrupt occurs which triggers the execution of an ISR, after code execution exits the ISR it returns to the Super Loop until the next interrupt occurs.

The Super Loop can often contain a statement which when executed force the microcontroller into a low power or sleep mode, i.e., to same power.

ok, another question. I have just started debugging but the part I want to see most is in the ISR which triggers the ADC using PWM special event trigger. But while running in debug mode (Step Into or Animate), it keeps looping around the while loop and never enters ISR.

Is this some sort of limitation with the debug mode? Or is it still possible using some special settings? I know this might be written somewhere in the manuals but I have no idea where to start. I can't seem to find some explanation on google also. Please point me to the right direction.

All methods of debugging have their strengths and weaknesses, rather than single stepping through the code or initiating Animate mode, try setting a breakpoint on a code statement at the end of the ISR and initiate code execution to Run.

After the code executes any initialization routines, it should remain in the Super Loop until an interrupt occurs, which in turn should trigger the execution of the ISR if proper configured and stop at the breakpoint set in the ISR.

One issue to keep in mind when single stepping or setting breakpoints, essentially such debugging techniques take control of the microcontrollers clocking, this can have undesired circumstances in some situations.

An example of just such a situation is debugging UART interaction with serial traffic, while the debugging software and the ICD3 can control the clocking of the microcontroller, in effect slow, pause or stop the code execution, they have no effect on the device receiving or transmitting the data from the microcontrollers UART, which in turn can cause loss of synchronization or data.

Typically these types of situations are best handled with more advanced debugging hardware with Trace features, like the Microchip RealICE.

Or using the ICD3 to set a breakpoint after the UART traffic has been received and examining any buffers which contain the received data.

The manual says Program mode is used only for dspic30f devices. I've never used them so I just keep it on USB/Debug mode

My primary concern was the possibility of the PIC18F interfering with either programming or debugging lines.

It appears the only purpose of the PIC18F is to form a USB to UART bridge to facilitate asynchronous communications with a PC.

Of course, just as the pin location of the PGCx/EMUCx and PGDx/EMUDx pairs from one PIC model to another, so does the location of the TX/RX pairs.

Depending on the specific PIC, you may find this USB to UART bridge nonfunctional in some cases.


BigDog
 

Status
Not open for further replies.

Similar threads

Part and Inventory Search

Welcome to EDABoard.com

Sponsor

Back
Top