Welcome to our site! EDAboard.com is an international Electronics Discussion Forum focused on EDA software, circuits, schematics, books, theory, papers, asic, pld, 8051, DSP, Network, RF, Analog Design, PCB, Service Manuals... and a whole lot more! To participate you need to register. Registration is free. Click here to register now.
..Hello,
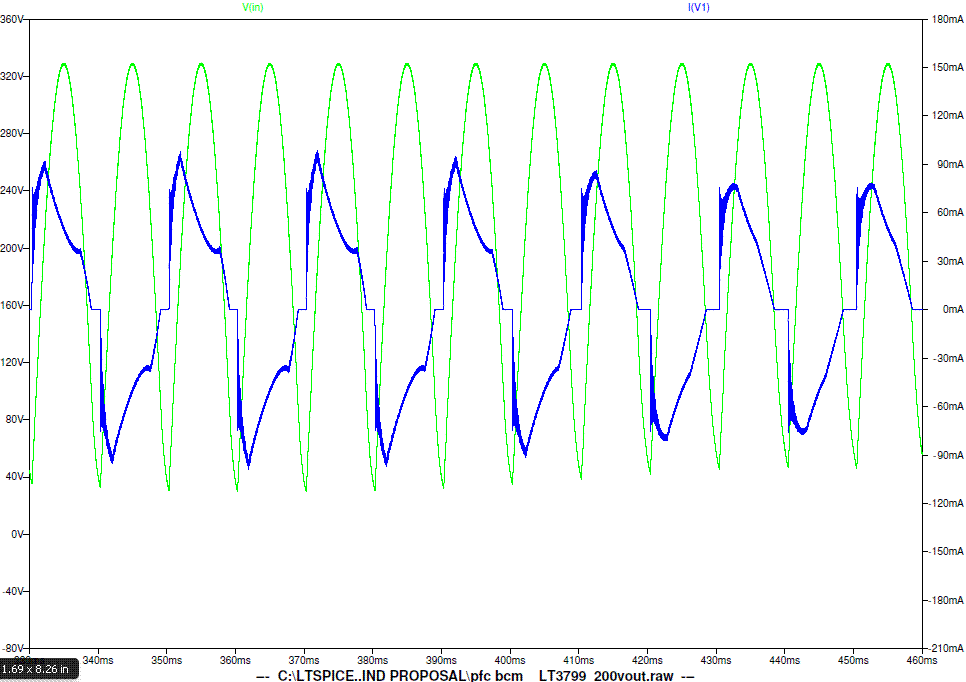
..It is the mains current waveform into a simulation of a 10W flyback LED driver (mains voltage also shown)
Unfortunately, LTspice doesn't do power factor.
you can implement the calculation using Matlab (or Scilab or any other math tool) applying the FFT analysis to the voltage and current vectors extracted from the simulation in LTspice.
I don't agree very much with your calculation.
I see (in your last pdf file) that also the voltage isn't (perfetct) sinusoidal, the lower part is increasing with time and doesn't follow the sinus shape. Furthermore a non-zero DC is superimposed.
The 1MB(!!!) PDF you attached contains this image:
What is the green trace supposed to be showing? It's certaily not mains voltage, and isn't even a very good representation of full-wave rectified mains voltage.
The amplitude and waveform of both the green and blue traces are constantly changing as well, so whatever they are, this isn't even a steady-state measurement.
Was there any purpose in uploading this other than to waste server space and waste our time and bandwidth when we download it? At least the (sensibly sized) image you showed in post 1 made sense.
right, I now see your point, I measured it in the wrong place..its actually zero dc level.
as you know pfc ccts have slow feedback loops and take ages to get into steady state
This site uses cookies to help personalise content, tailor your experience and to keep you logged in if you register.
By continuing to use this site, you are consenting to our use of cookies.