Continue to Site

Welcome to EDAboard.com

Welcome to our site! EDAboard.com is an international Electronics Discussion Forum focused on EDA software, circuits, schematics, books, theory, papers, asic, pld, 8051, DSP, Network, RF, Analog Design, PCB, Service Manuals... and a whole lot more! To participate you need to register. Registration is free. Click here to register now.

Antenna Comparison for Datasheet and VNA

Status
Not open for further replies.

satilla

Newbie
Joined
Mar 12, 2018
Messages
2
Helped
0
Reputation
0
Reaction score
0
Trophy points
1
Activity points
34
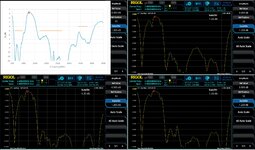
I have purchased two antennas and measured the "Return Loss" parameters.
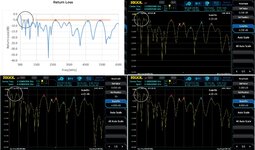
The datasheet graph is shown on the left side (white background) of the photo, with other images taken by my VNA.
If I compare the datasheet graph and my VNA's graph, I see some values not shown on my measurement.

These differences are normal or do I have an issue with my VNA?
 

Attachments

  • W1696.jpg
    W1696.jpg
    542.2 KB · Views: 122
  • W5150.jpg
    W5150.jpg
    550.3 KB · Views: 123

If your antenna is placed at a decent distance from the ground and from the nearby objects, you don't have issues with your VNA measurements.
Assuming the first picture is about a 2.4GHz to 2.5GHz antenna, and second picture is about a 2.4GHz-2.5GHz and 5.7GHz-5.9GHz antenna, seems that the antennas meet somehow the minimum return loss requirements (S11 better than -10dB).
 

Thank you for your comment.

Both antennas will be used in a GSM application. These are the antennas;

https://www.digikey.at/en/products/detail/pulselarsen-antennas/W1696/10125534 (first image)
https://www.digikey.at/en/products/detail/pulselarsen-antennas/W5150/13244581 (second image)

For the first antenna (W1696) I measure one point that exceeds -10db, but in the datasheet, there are two points above -10db between 500MHz to 1000MHz.

For the second antenna (W5150) I should see-38db on the 2.4 GHz according to the datasheet. But I measure different values for this frequency. I will also have to use sub-GHz GSM bands and even though the graphs are similar, different bottom values appear at many points.
 

I should see-38db on the 2.4 GHz according to the datasheet. But I measure different values for this frequency

Don't be fooled by such S11 values in dB scale. If you look at Smith chart, S11 of -38dB is in the center and -20dB is very close to the center. Both values are nicely matched.
 

Status
Not open for further replies.

Part and Inventory Search

Welcome to EDABoard.com

Sponsor

Back
Top