Continue to Site

Welcome to EDAboard.com

Welcome to our site! EDAboard.com is an international Electronics Discussion Forum focused on EDA software, circuits, schematics, books, theory, papers, asic, pld, 8051, DSP, Network, RF, Analog Design, PCB, Service Manuals... and a whole lot more! To participate you need to register. Registration is free. Click here to register now.

ADS LSSP

Status
Not open for further replies.

ABHI j

Newbie
Joined
Nov 6, 2022
Messages
4
Helped
0
Reputation
0
Reaction score
0
Trophy points
1
Activity points
41
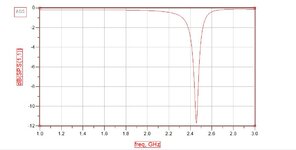
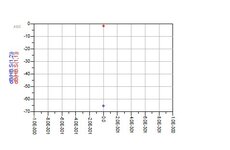
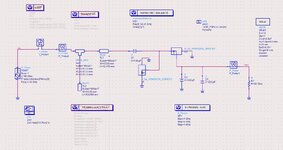
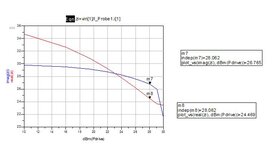
HOW i display LSSP graph for the circuit. Which opinion should i select in X and Y axis In order for view after simulation.
Is LSSP and HB are almost same.
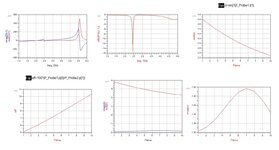
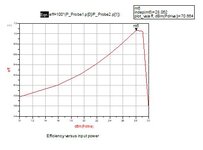
I need input impidance vs efficiency graph.
IMG-20221103-WA0003.jpg
 

Attachments

  • IMG-20221103-WA0004.jpg
    IMG-20221103-WA0004.jpg
    45.8 KB · Views: 135
  • IMG-20221103-WA0006.jpg
    IMG-20221103-WA0006.jpg
    20.4 KB · Views: 121

Efficiency=Pprobe1/Pprobe2
Since the frequency is constant, the Input Impedance is not frequency depended. It may be depended on Applied Power. But it doesn't make sense unless the Applied Power is constant.
This is possible in transient domain only.
 

Thankyou for replying sir
I simulated but my efficiency is to low. And my impidance Vs pdrive is displaying as short period of pdrive.
How to slove this...
 

Attachments

  • circuit.JPG
    circuit.JPG
    201.7 KB · Views: 131
  • effci.JPG
    effci.JPG
    121.7 KB · Views: 124

Your schematic is an ordinary voltage doubler.
It accepts AC supply.
Outputs DC at 2x nominal AC volt level.

The key word is nominal. Although the waveform consists of peaks at 1.414x nominal voltage...
Your math must be based on RMS value.
To measure AC supply Watts you must take an average reading. Only then can you compare it to DC load Watts, when you calculate efficiency.

I'm running a simulation similar to yours. It displays average readings. The AC supply sees a certain impedance. It consists of: a) the input resistor, and b) the rest of the circuit.

The chief thing to notice is that AC peak readings are very different from their average DC equivalent. Your circuitry, or your calculations, must take this into account.

Villard V doubler scope shows power consumed.png
 

No sir it is 4kohm. I made a mistake on it.
These are the graph that I have obtained while simulation. Is it correct ?????
How to change the output voltage into V RMS - simply put the equation for it(Vm/2) or any other....
 

Attachments

  • picture 4 1.JPG
    picture 4 1.JPG
    27.9 KB · Views: 110
  • picture 51.JPG
    picture 51.JPG
    27.5 KB · Views: 108
  • picture 1.JPG
    picture 1.JPG
    37.5 KB · Views: 106
  • picture 2.JPG
    picture 2.JPG
    38.3 KB · Views: 95
  • picture 3.JPG
    picture 3.JPG
    36.6 KB · Views: 108

I don't know they are correct or not. The output voltage is DC so rms value is not defined for it at all.
You can improve the input impedance a bit more. It will also improve the efficiency.
 

Notice that my simulation gives average Watt readings.
.124 at the power source.
.092 at the load.
Efficiency calculates as .092/.124.

To produce a graph of efficiency vs input impedance, change the 50 ohms to a variety of values and run simulations.

Then for each run, one way or another, you must find the average Watts drawn from your power source.
Either:
a) the simulator does this for you (like Falstad's which I use), or
b) you must attach components that perform averaging, or
c) you must hand-calculate the area under the curve of an entire cycle, or
d) find Amperes (rms), and multiply by supply Vrms.
 

Status
Not open for further replies.

Part and Inventory Search

Welcome to EDABoard.com

Sponsor

Back
Top