Continue to Site

Welcome to EDAboard.com

Welcome to our site! EDAboard.com is an international Electronics Discussion Forum focused on EDA software, circuits, schematics, books, theory, papers, asic, pld, 8051, DSP, Network, RF, Analog Design, PCB, Service Manuals... and a whole lot more! To participate you need to register. Registration is free. Click here to register now.

ADC conversion doesn't behave as expected. Adaptation required?

Status
Not open for further replies.

Damaso

Newbie level 3
Joined
Sep 20, 2013
Messages
4
Helped
0
Reputation
0
Reaction score
0
Trophy points
1
Activity points
50
I've designed a Galvanostat (meassures the voltage drop vs time in a sample while applying a constant current) and the final ADC conversion shows some extrange behaviour. Instead of showing a continous variation in the voltage meassured, it show a ramp-like conversion. Meaning, the conversion is constant for a few samples, providing the exact same 16bits value, and then jumps to the next voltage value. This behaviour is more visible as the rate of change in voltage lowers.

I tried changing the ICs in the circuit, changing the experiment conditions and many other things, but the problem seems to be in the way the ADC reads the data.

I was using a multimeter to read the in voltage and, strangely enough, while the multimeter was connected, this behaviour disappeared and the conversion went as expected, but a bit of noise was added. I suppose that the multimeter pressence stabilized somehow the ADC reading, but i wasn't able to recreate it on my own.

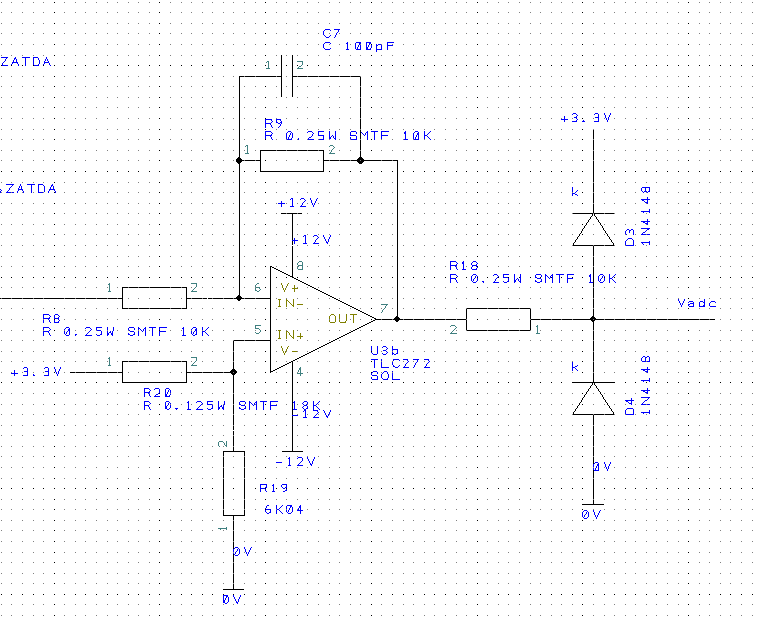
Here are some images of my circuit and the curves I got from different same-conditions experiments. The one in black is meassured with the multimeter connected. It is of note than the other three show the exact same "stairs" at the same voltage values.

Can anyone please give me a hint of what may be happening?
Schematics.jpg
Curves.jpg
 

While I am unable to exactly understand the working of your circuit, especially the bit with the opamp which looks like a standard non-inverting config. Except that you have biased the +ve to +2.5v, and the -ve to Gnd. Why is this ?

Also there is no details of what your amp_out signal looks like.

It would appear that the opamp output should stay fixed at 5v, if there is no signal at the amp-out point. The exact voltage of course depends on the precision of the 2.5v, and also the precision/ matching of your resistors.

So why your ADC shows a decreasing voltage, and that too a negative one ?

Also i cannot see where the constant-current part is, nor what is the purpose of the cap in the feedback path. Lastly the purpose of the 5K at opamp output also eludes me.

Having said all that, it would appear that connecting the meter is probably equivalent to connecting an impedance to Gnd, and somehow that helps by providing a current path ? Which meter did you use - i.e. what impedance ?
 
Last edited:

Well, I'm only showing the last past of the signal path, which I think is the only part relevant for my question. The ADC I'm using only accepts 0 to 5V at the +IN and the circuit up to the amp_out signal is designed to output a -2.5 to +2.5 signal. So the last opamp is there to add a 2.5V reference voltage an make the amp_out signal compatible with the ADC.
My designed is used to meassure voltage drops in a chemical process when excited with a costant current (a galvanostat). The amp_out signal shows the variations through time of that voltage as the reaction occurs. The voltage shown in the graph is the software translation of the ADC data, calculated by substracting the 2.5V and then multiplying by some resistant values.
The cap in the feedback path is there to provide a simple LP filter and to increase the stability of the opamp and the 5K is used in conjunction with the diodes to prevent that the voltage going into the ADC goes outside the 0 to 5V limits.
The meter I used has a 10MOhms impedance when meassuring voltage
 

Hi Damaso,

I designed a similar circuit for my mBed module which uses 0 to 3V3 input and my converter circuit made it bipolar.
I have attached it for comparison and thoughts on the possible issues.


Although my circuit is inverting it is quite similar (I also used BAT... diodes, but they were not in my CAD package)
The big difference is the bias of 2V5 in your case and 3V3 in mine.
My circuit provides a constant voltage at the In+ of the opamp and more importantly as it is driven from a low impedance opamp before this a low and constant impedance, hence the resistor R20 in my circuit include additional external impedances is fixed. The importance of this is the 3V3 is divided correctly (I'll come back to this point in a minute)

In your circuit the voltage at the input labled Amp out is as the previous poster stated driving 20K to 2V5 so does have to be able to sink 0.125mA which is not much but could be an issue?

The other point is resistor values, when biasing the inputs for bipolar operation make sure you get the correct gain for each input to ensure the 2V5 is being used as expected. Note in my circuit the 'odd' resistance values to give the 3V3/2 offset I needed. This may not be the same for your configuration but just check.

In summary check how you driving R23, if it's in anyway not near zero impedance then put in a buffer.
The effect from placing of the meter in the circuit to me indicates the drive signal is a high(ish) or capacitive and without the meter your current from R23 is charging/discharging this capacitance.
 

I meassure the voltage drop in the chemical reaction via a voltage follower and then I make some transformations to it so it matches the desired -2.5 to 2.5 at amp_out (or R23). This signal it driven by the output of an opamp, so it can output or sink the desired current and also the correct low impedance. The 2.5V addition works flawlessly, so the problem is not in the resistors values.
How can I check if there's a capacitive problem and how should I mitigate it?
 

As per your explanation all of it sound good. But the anomaly remains.

I did note that your plateaus occur almost exactly at 20mV spacing, and last for ~ 1sec.
Which leads me to ask - what is your conversion rate, and how many bits are you using ?

And lastly - power supply & grounding needs to be examined, especially the -IN grounding of the ADC.
 
Last edited:

In the graphs shown, the experiment was carried with a 100ms sample rate, but my software can change that value to whichever I want. Also, the length of the plateaus only depends on the experiment's voltage change rate, as it keeps the same slope as when it works correctly (with the multimeter connected).
The plateaus occur at 10mV, and this value is the same in every experiment. Keep in mind that the voltage shown in the graph is the voltage drop in the experiment, not the one meassured by the DAC. The conversion is made with the full 16bits allowed by the IC, and that 10mV is, in DAC values, an exact 64. That value is a power of 2, so it's too much of a coincidence, isn't it?. I can show you an excel sheet with the saved data from several experiments, and the same exact DAC value (with +-1 variations) is read several times in a row. It's impossible that the signal is so stable that a 16bits DAC reads the same value 4, 5 or even 6 times in a row or show only a 1 or 2 bits difference in 10 consecutive meassurements.
 

Thats exactly what i was trying to drill down to. Too much of a coincidence is worth checking out. Seems to point to a possible flaw in the coding ? 2^6 = 64 = 10mV and the same sample is read 6 times in succession .... one more 6 and we'll really be in trouble. :) Maybe that plateau is 6x100 = 0.6 sec, and not 1 sec which i estimated ?

Search your code for occurences of 6 !!!!!
 

Status
Not open for further replies.

Part and Inventory Search

Welcome to EDABoard.com

Sponsor

Back
Top