Continue to Site

Welcome to EDAboard.com

Welcome to our site! EDAboard.com is an international Electronics Discussion Forum focused on EDA software, circuits, schematics, books, theory, papers, asic, pld, 8051, DSP, Network, RF, Analog Design, PCB, Service Manuals... and a whole lot more! To participate you need to register. Registration is free. Click here to register now.

[SOLVED] How to plot constant Q curves on the ADS datadisplay smith chart

Status
Not open for further replies.

tahmis91

Newbie level 4
Joined
Feb 2, 2017
Messages
6
Helped
1
Reputation
2
Reaction score
1
Trophy points
3
Activity points
48
Dear all,

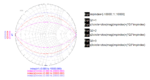
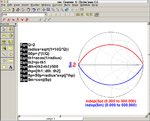
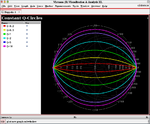
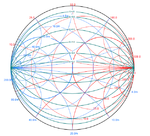
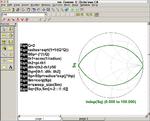
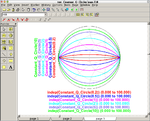
Do anybody know how to plot the constant Q curves on the ADS keysight datadisplay? (I want to use them for matching) (I found that on the Smith chart utility tool, there is an option to play them, but I want to plot them on the data display, I mean, when I simulate "real-non ideal from a given technology design kit"

Thank you,
 

Do you mean locuses of Q=X/R or Q=B/G on smith chart ?

Yes, I mean locuses of Q = X/R ( Q isn't the same value for both X/R for circuit in serie or B/G for circuit in parallel ?! and, isnt the same for both Z chart or Y chart or ZY chart?)

Thank you,
 

No.

Gamma=(Z/Z0-1)/(Z/Z0+1)=-(Y/Y0-1)/(Y/Y0+1)

Yes, of course there is a shift of 180 degree between Gamma calaculated according to Z and that calculated with Y, I didn't say the opposite.

But, the locus of constante Q in the Z, Y, and ZY chat is the same, for example, for Q=1, the locus ploted in the Z, Y and ZY chart is the same.

Anyways, how to plot the constant Q circle in the Z chart

Thanks,
 

Draw partial circle based on definition.
Center is (0, +1/Q) or (0, -1/Q).
Radius is sqrt(1+1/Q^2).
 
Last edited:

Draw partial circle based on definition.
Center is (0, +1/Q) or (0, -1/Q).
Radius is sqrt(1+1/Q^2).

I don't know how to access to the resistance and reactance of the smith chart on the ADS datadisplay to plot the Q
And, I don't know how to plot the equation of a circle on ADS datadisplay

I want to notice that is not as simple as we could think, I searched but didnt find, this is why I am asking here

Thanks
 

I'm also interested. Please tell us about the simple method how to draw these circles in ADS data display.

There is one solution on the attached document,
 

Attachments

  • Capture.PNG
    Capture.PNG
    75 KB · Views: 461
I'm also interested.
Please tell us about the simple method how to draw these circles in ADS data display.
If needed, create custom AEL function.

Actually I have custom Skill function "Constat_Q_Circle(Q)" which returns Gamma for Q in Cadence dfII.

There is one solution on the attached document,
It's too unefficient since S is bilnear transformation of z, S=(z-1)/(z+1).

I found that on the Smith chart utility tool, there is an option to play them
I think a following is good than Smith chart utility tool of ADS.

https://www.fritz.dellsperger.net/smith.html
 

Attachments

  • 2018-0220-1247-39.png
    2018-0220-1247-39.png
    82.3 KB · Views: 284
  • 2018-0220-1206-25.png
    2018-0220-1206-25.png
    82.5 KB · Views: 377
  • 180220-190737.png
    180220-190737.png
    121.9 KB · Views: 300
Do you mean locuses of Q=X/R or Q=B/G on smith chart ?

Qserie=X/R=Qparallel=B/G => So, it results on the same

It is simple to demonstrate by taking a serie R-L circuit and calulate the parallel equivalent R-L...
 

"Constant_Q_Circle.ael"
Code:
defun Constant_Q_Circle(Q)
{
  decl radius, S0p, th1, th2, dth, thp, nlen, Sp, Sm, Sq;

  radius = sqrt( 1 + 1/(Q*Q) );
  S0p = -j * (1/Q);

  th1 = acos(1 / radius);
  th2 = pi - th1;
  dth = (th2 - th1) / 50;

  thp = [th1::dth::th2];
  nlen = sweep_size(thp);
  
  Sp = S0p + radius * exp(j*thp);
  Sp[0] = 1.0;
  Sp[nlen-1] = -1.0;
  
  Sm = conj(Sp);

  Sq = [ Sp, Sm[nlen-2::-1::0] ];

  return Sq;
}
 

Attachments

  • 2018-0223-0909-44.png
    2018-0223-0909-44.png
    100.9 KB · Views: 231

Status
Not open for further replies.

Part and Inventory Search

Welcome to EDABoard.com

Sponsor

Back
Top