Continue to Site

Welcome to EDAboard.com

Welcome to our site! EDAboard.com is an international Electronics Discussion Forum focused on EDA software, circuits, schematics, books, theory, papers, asic, pld, 8051, DSP, Network, RF, Analog Design, PCB, Service Manuals... and a whole lot more! To participate you need to register. Registration is free. Click here to register now.

[SOLVED] Cadence S-parameter analysis

Status
Not open for further replies.

kenambo

Full Member level 6
Joined
Feb 26, 2012
Messages
393
Helped
52
Reputation
104
Reaction score
48
Trophy points
1,308
Location
India
Activity points
3,859
Hi All,

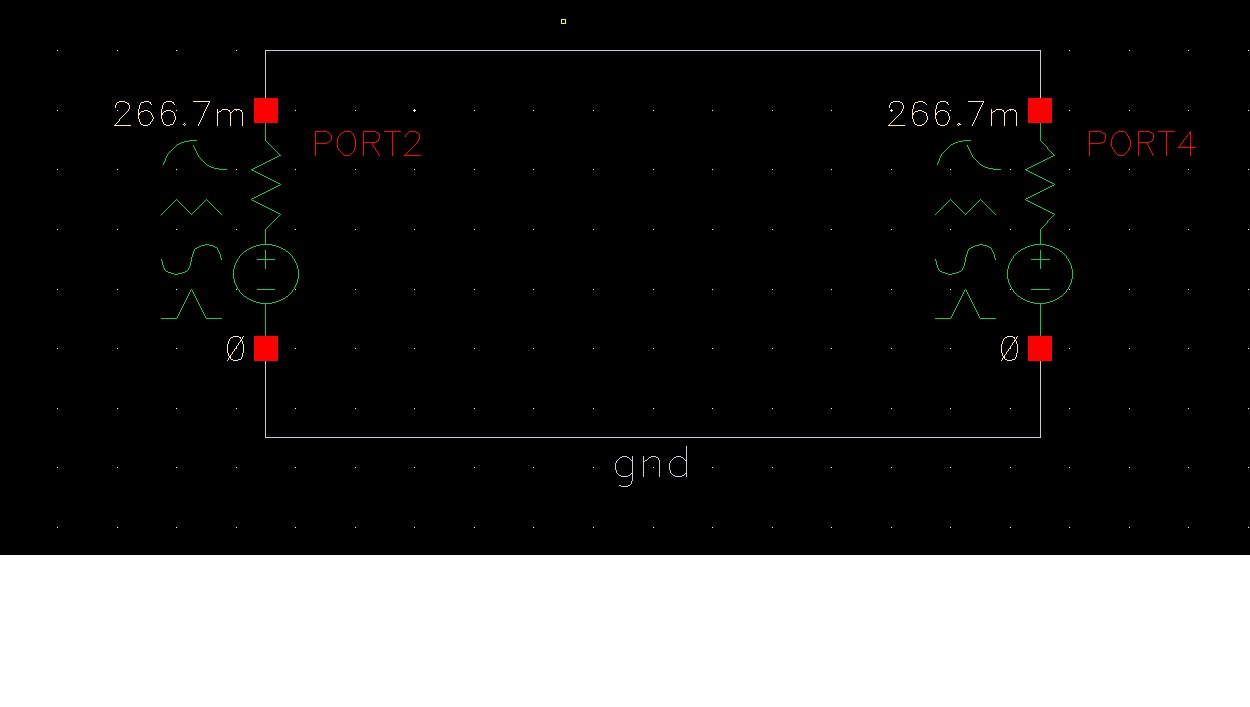
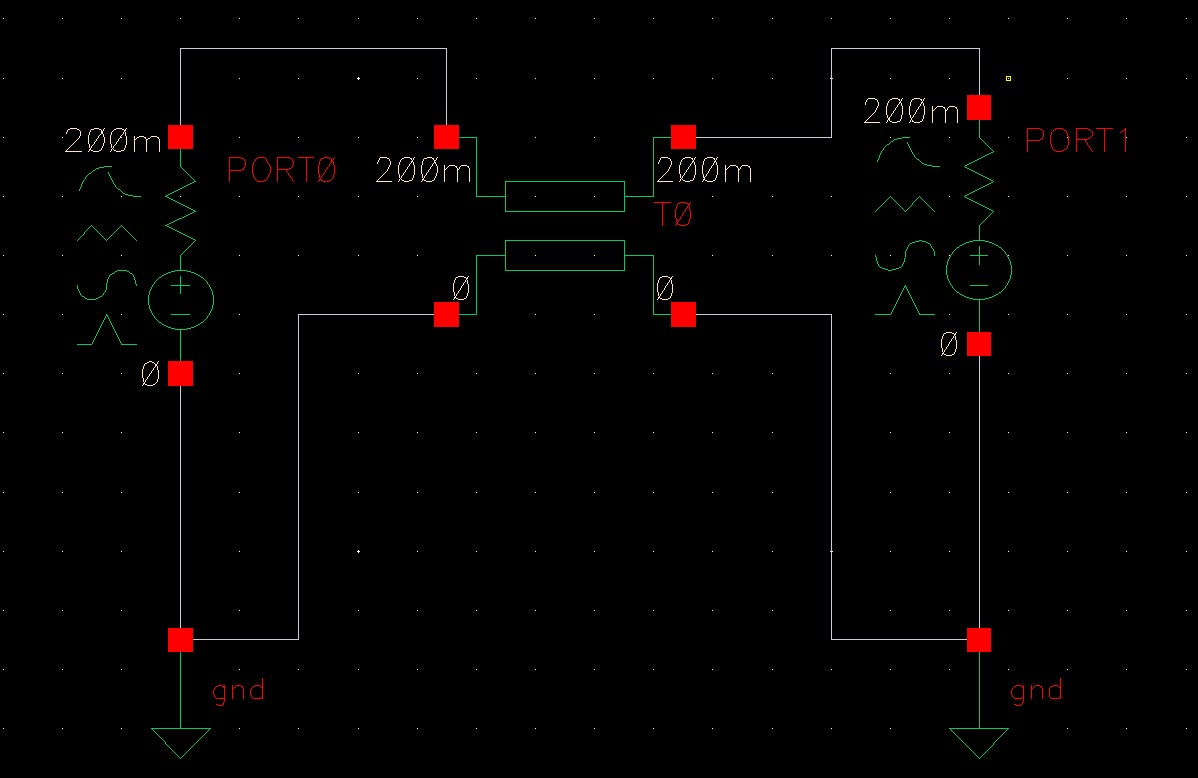
I set up a circuit to check sp analysis in cadence. I m having 2 ports with one port has 50 ohm and another port has 100ohm. I connected these two ports together.While I am doing SP analysis, I got the following results.

S11 = S22--> 333.33m

S12=S21 --> 942.809m

How S12 is calculated in the above case. I couldn't find any formula reference for the above values.

Can anyone tell me how spectre determines these values?

Thanks.
 

Too easy, kindergarten level.

>> r01=50;
>> r02=100;

>> s11=(r02-r01)/(r02+r01)
s11 = 0.3333

>> s22=(r01-r02)/(r01+r02)
s22 = -0.3333

>> Pa1=1/(4*r01);
>> Pa2=1/(4*r02);

>> Pload2=(r02/(r01+r02))^2/r02;
>> Pload1=(r01/(r01+r02))^2/r01;

>> s21=sqrt(Pload2/Pa1)
s21 = 0.9428

>> s12=sqrt(Pload1/Pa2)
s12 = 0.9428

See https://www.designers-guide.org/Forum/YaBB.pl?num=1266168115/1#1
 
Last edited:

    V

    Points: 2
    Helpful Answer Positive Rating
Hi

Thanks for the answer. I got it. But when I insert a transmission line between these two ports the s-parameter looks different. Is there any derivations or equation for s-parameter with transmission line included?
My setup is two 50 ohm ports are connected using TLINE of 100 ohms characteristic impedence with 25cm length. It will include the length of the transmission line right?


Thanks.
 

I can provide an equation for input impedance of a lossless line with arbitrary load impedance:

line.PNG

You can calculate S11 from this. And for a lossless line, we have |S11|2 + |S21|2 = 1 so you can calculate magnitude of S21 also.

For cascading, look at ABCD parameters and how they are converted to/from S-parameters.
 
I can provide an equation for input impedance of a lossless line with arbitrary load impedance:

View attachment 137251

Hi

Thanks for the hint. Is this from any book? If so can you please tell the book's name?

And I am interested to see the cadence analysis of a transmission line.

Thanks
 

Is this from any book?
You can see such very basic equation in any basic text on linear circuit theory.

If so can you please tell the book's name?
I recommend following standard text book, if you don't have any text book.
https://www.amazon.com/Microwave-En...d=1348984645&sr=1-3&keywords=microwave+mixers

And I am interested to see the cadence analysis of a transmission line.
You will face many fatal bug of Cadence Spectre.
I don't recommend to believe Cadence Spectre reagarding RF.
 
Last edited:
Thank you guys.

I will study the basics..

- - - Updated - - -

Too easy, kindergarten level.

>> r01=50;
>> r02=100;

>> s11=(r02-r01)/(r02+r01)
s11 = 0.3333

>> s22=(r01-r02)/(r01+r02)
s22 = -0.3333

>> Pa1=1/(4*r01);
>> Pa2=1/(4*r02);

>> Pload2=(r02/(r01+r02))^2/r02;
>> Pload1=(r01/(r01+r02))^2/r01;

>> s21=sqrt(Pload2/Pa1)
s21 = 0.9428

>> s12=sqrt(Pload1/Pa2)
s12 = 0.9428

See https://www.designers-guide.org/Forum/YaBB.pl?num=1266168115/1#1

Hey pancho,

I need one more help. How can I convert the above values into a smith chart? Do you have any idea? I have done it using sp anlysis in cadence. I saw some theory formulae too. But I couldn't relate my values to them. So any clue will help.

i have found it for s11. s11=0.333 which is our reflection coefficient. So smith chart is a impedence thing. so it converts to 2+j0 . [ z1 = 1+s11/1-s11]. right? and I am seeing the same result on smith chart.

But for s21 which is 0.942 it converts to 33.97+j0 in smith chart. Do you know any formula or calculation for this?

thanks
 
Last edited:

How can I convert the above values into a smith chart?
Do you have any idea?
I have done it using sp anlysis in cadence.
I saw some theory formulae too.
But I couldn't relate my values to them.
So any clue will help.
I can not understand what you want to mean at all.

Describe correctly.

i have found it for s11.
s11=0.333 which is our reflection coefficient.
So smith chart is a impedence thing.
I can not understand what you want to mean at all.

Describe correctly.

so it converts to 2+j0.
[z1 = 1+s11/1-s11].
right?
Wrong.
Zin/r01 = (1+s11)/(1-s11), r01=50

But for s21 which is 0.942 it converts to 33.97+j0 in smith chart.
I can not understand what you want to mean at all.
Can you understand s21 surely ?
You can not s21 on smith chart.
s21 is plotted on Polar Chart.

Do you know any formula or calculation for this?
I can not understand what you want to mean at all.

Simply, you can not understand Smith Chart at all.
See https://www.designers-guide.org/Forum/YaBB.pl?num=1455889675/1#1
 
Last edited:

I can not understand what you want to mean at all.

Describe correctly.

I can not understand what you want to mean at all.

Describe correctly.

Wrong.
Zin/r01 = (1+s11)/(1-s11), r01=50

I can not understand what you want to mean at all.
Can you understand s21 surely ?
You can not s21 on smith chart.
s21 is plotted on Polar Chart.

I can not understand what you want to mean at all.

Simply, you can not understand Smith Chart at all.
See https://www.designers-guide.org/Forum/YaBB.pl?num=1455889675/1#1

Hi,

yeah your description for z01 is right. I forgot to say it is normalized for 50Ohm.

Yeah S21 is not impedence thing. But in cadence SP analysis I saw a point located for s21 in smith chart. So that I was confused. Ok, so s21 has to be plotted on polar chart.

What I want to tell is, How to convert S-parameters into a smith chart? Is it clear now? If it is not possible, why in cadence SP analysis we have smith chart representation.?

I got some understanding about smith chart. How the circles are drawn so that I am confused with SP-analysis smith chart.

Thanks.
 

I forgot to say it is normalized for 50Ohm.
Not only that.
There is no parenthesis in your expression.

But in cadence SP analysis I saw a point located for s21 in smith chart.
I can not understand what you want to mean at all.
Describe correctly.

How to convert S-parameters into a smith chart?
I can not understand what you want to mean at all.
Describe correctly.
Smith Chart is a plane of S(reflection coefficient).
So there is no need to convert S-parameters into a smith chart at all.

why in cadence SP analysis we have smith chart representation.?
I can not understand what you want to mean at all.
Describe correctly.

I got some understanding about smith chart.
You can not understand even very basic at all.
Surely study https://www.designers-guide.org/Forum/YaBB.pl?num=1455889675/1#1

How the circles are drawn so that I am confused with SP-analysis smith chart.
I can not understand what you want to mean at all.
Describe correctly.

Surely study S-Parameters.
 
Last edited:

Status
Not open for further replies.

Part and Inventory Search

Welcome to EDABoard.com

Sponsor

Back
Top