Welcome to our site! EDAboard.com is an international Electronics Discussion Forum focused on EDA software, circuits, schematics, books, theory, papers, asic, pld, 8051, DSP, Network, RF, Analog Design, PCB, Service Manuals... and a whole lot more! To participate you need to register. Registration is free. Click here to register now.
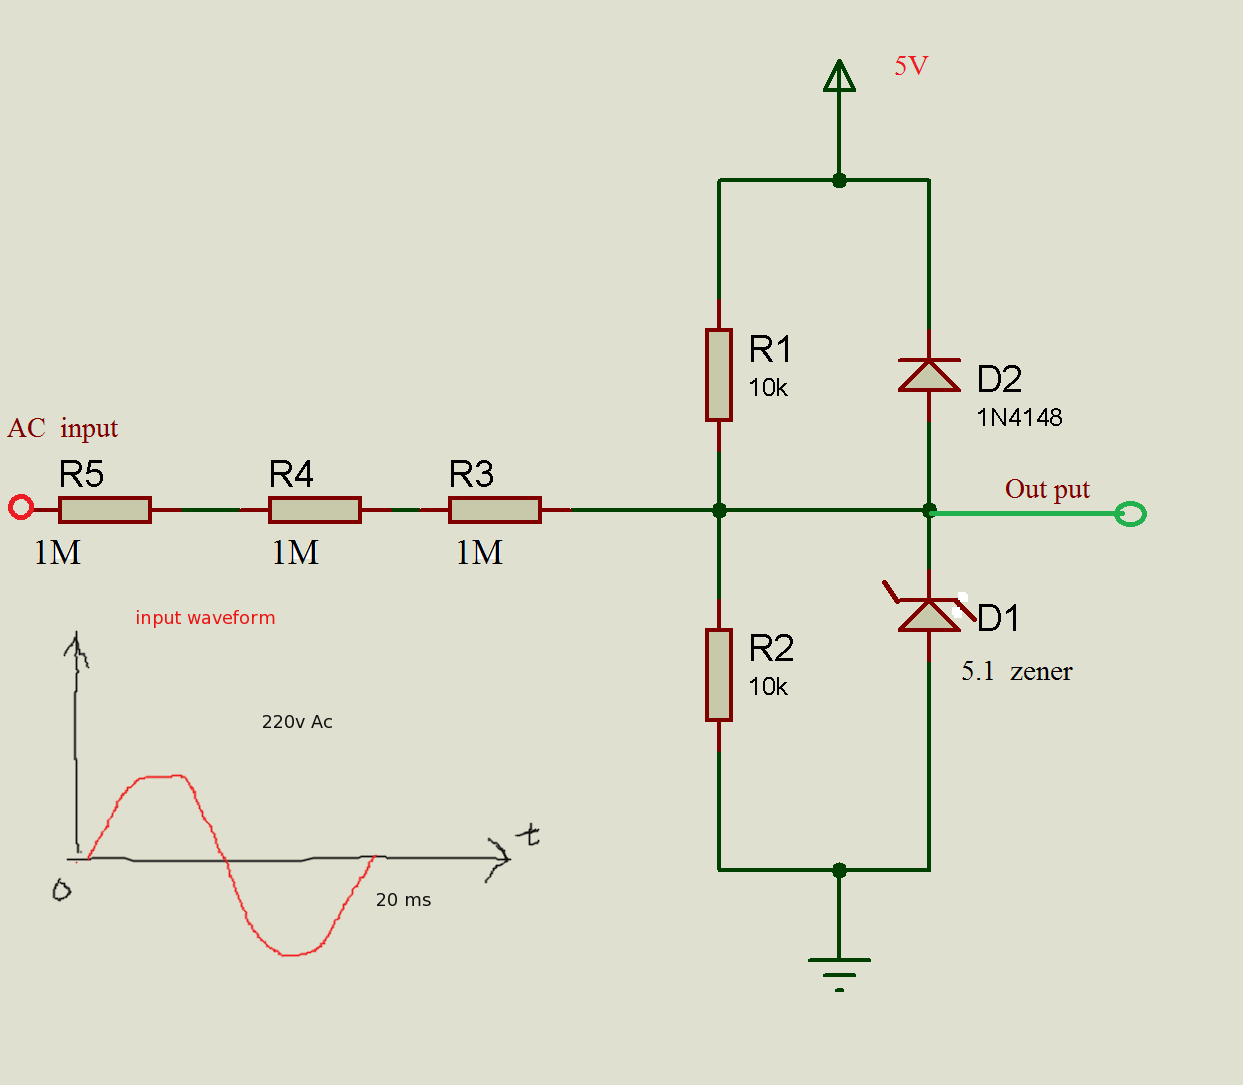
From the bellow picture what is the variation in out put if input is 220v Ac.
please draw the output waveform with time period(y-axis) and voltage (x-axis).
is that ac or dc ? can i measure through Microcontroller?.
thank s for your answer..
but here whats the need of two diods ?, and can i measure this small out put variation (if i/p=0 then o/p=2.5 ,,& if i/p=210v then o/p =2.7) through microcontroller? if yes please give the code for any mc.
Diodes D1 and D2 act as transient supressors.
If input signal includes high transients for ex. 2kV,
zener D1 short over 5.1V to GND and diode D2 short over 5.7V to 5V supply
( 5.7V = Vsupply + Vd )
This site uses cookies to help personalise content, tailor your experience and to keep you logged in if you register.
By continuing to use this site, you are consenting to our use of cookies.