jasonmgeorge
Newbie level 6
I'm attempting to characterize a few cells and I need to capture static and dynamic power (I'm lumping short circuit power in here) but I'm having some problems.
My operating principal is total power consumption is a combination of static power and dynamic power.
See https://users.ece.gatech.edu/~jeff/ece4420/powerlecture.pdf
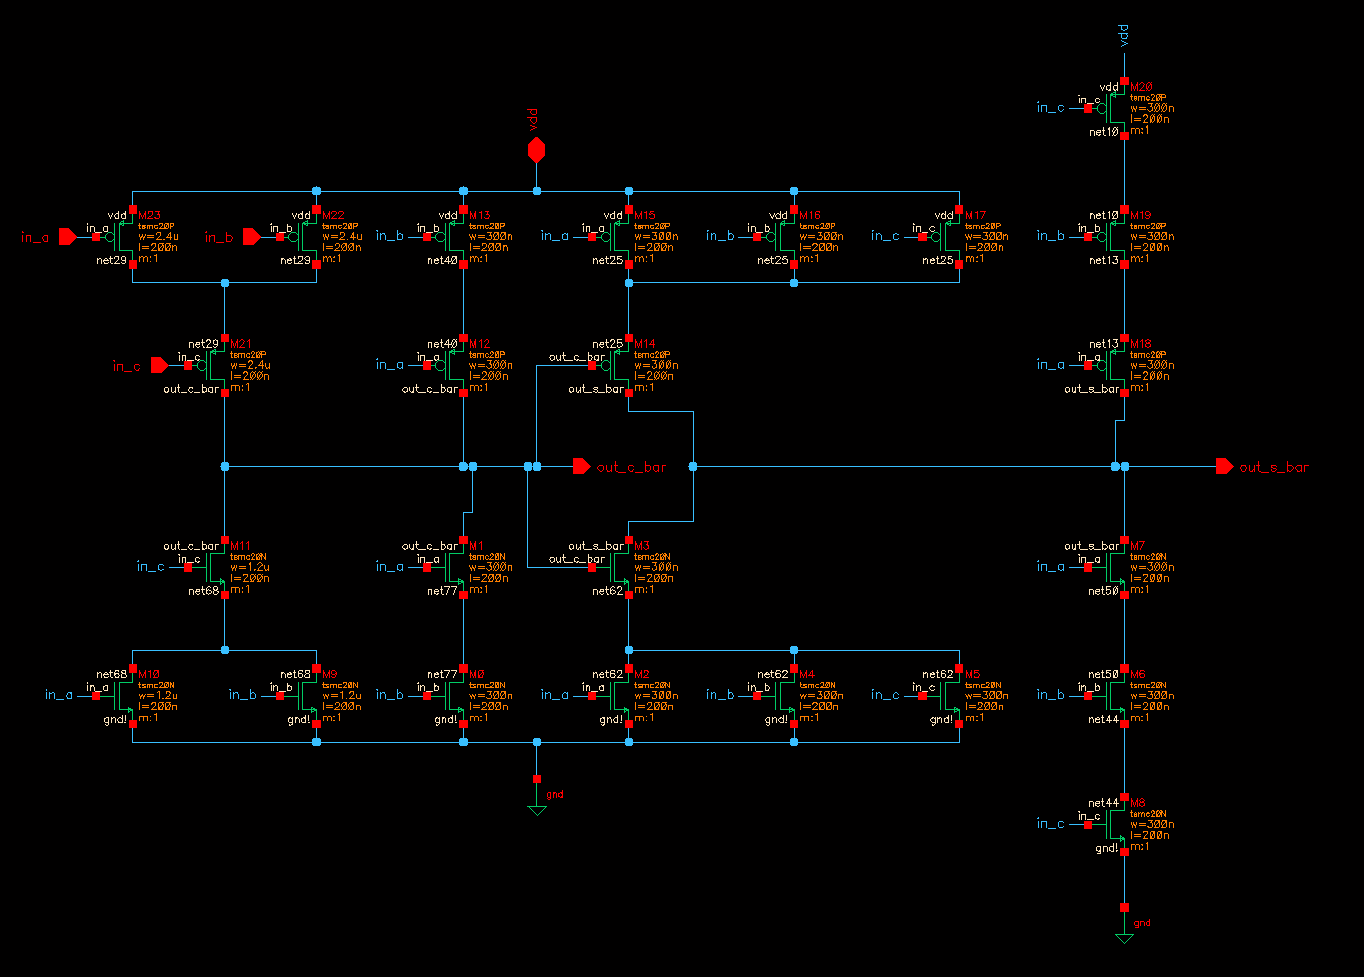
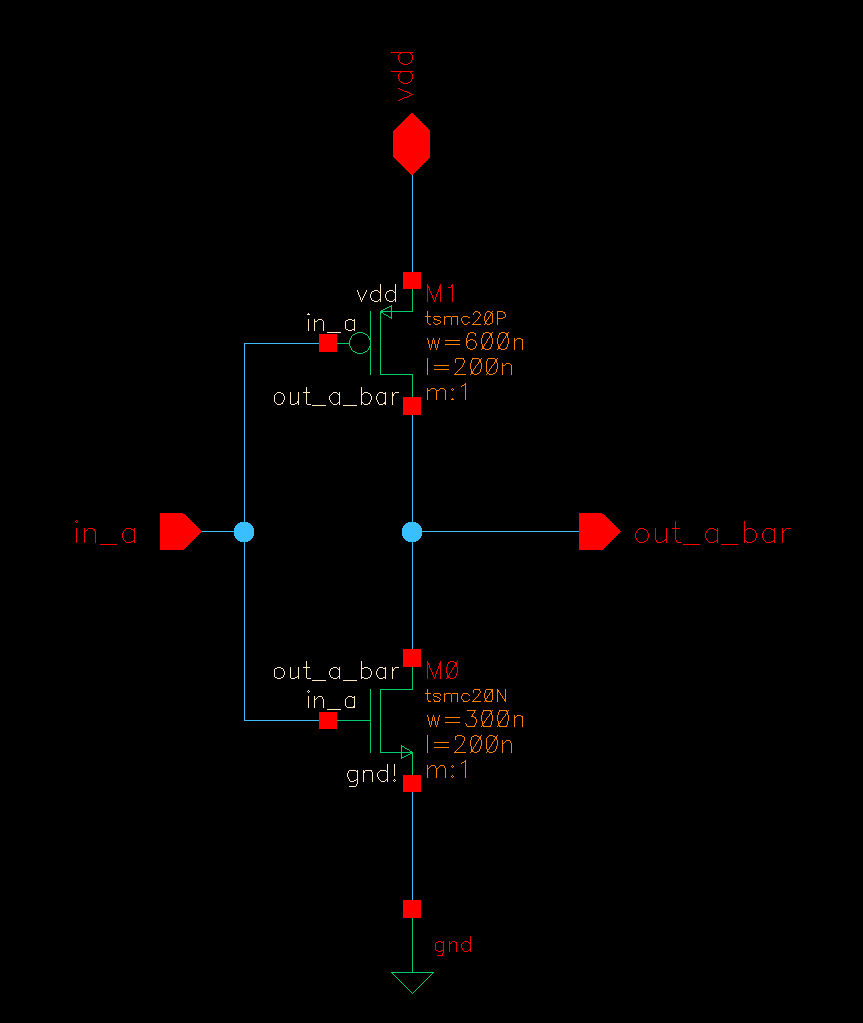
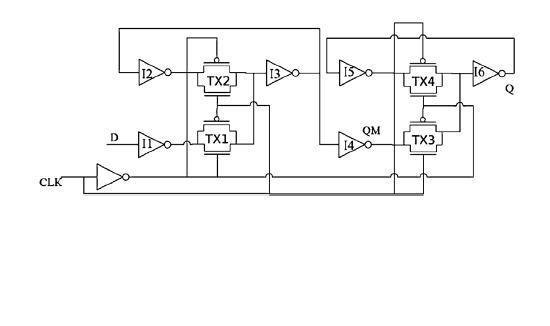
The first cell I'm trying to characterize is a full adder. I want to calculate the static power consumption for all possible states (input combinations) and the dynamic power consumption for all possible state transitions.
Since I need to do several cells over several operating voltages I want to make all the calculations in a single run for each operating voltage. First I run my state transitions, then move to each state for an extended period of time to measure static current.
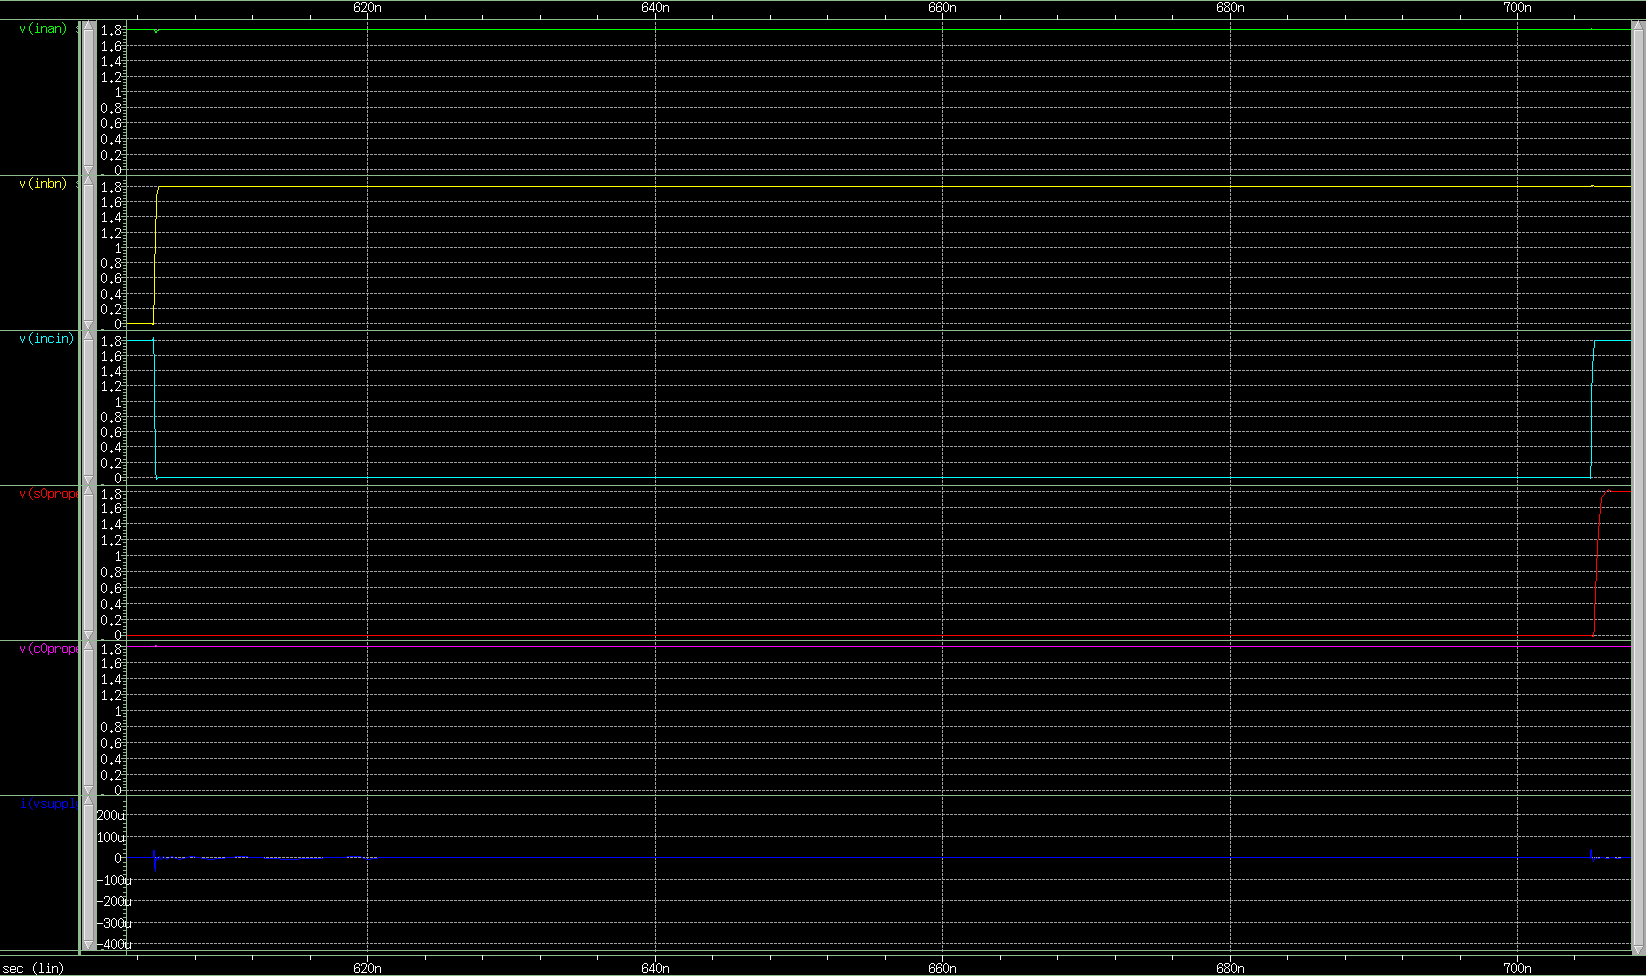
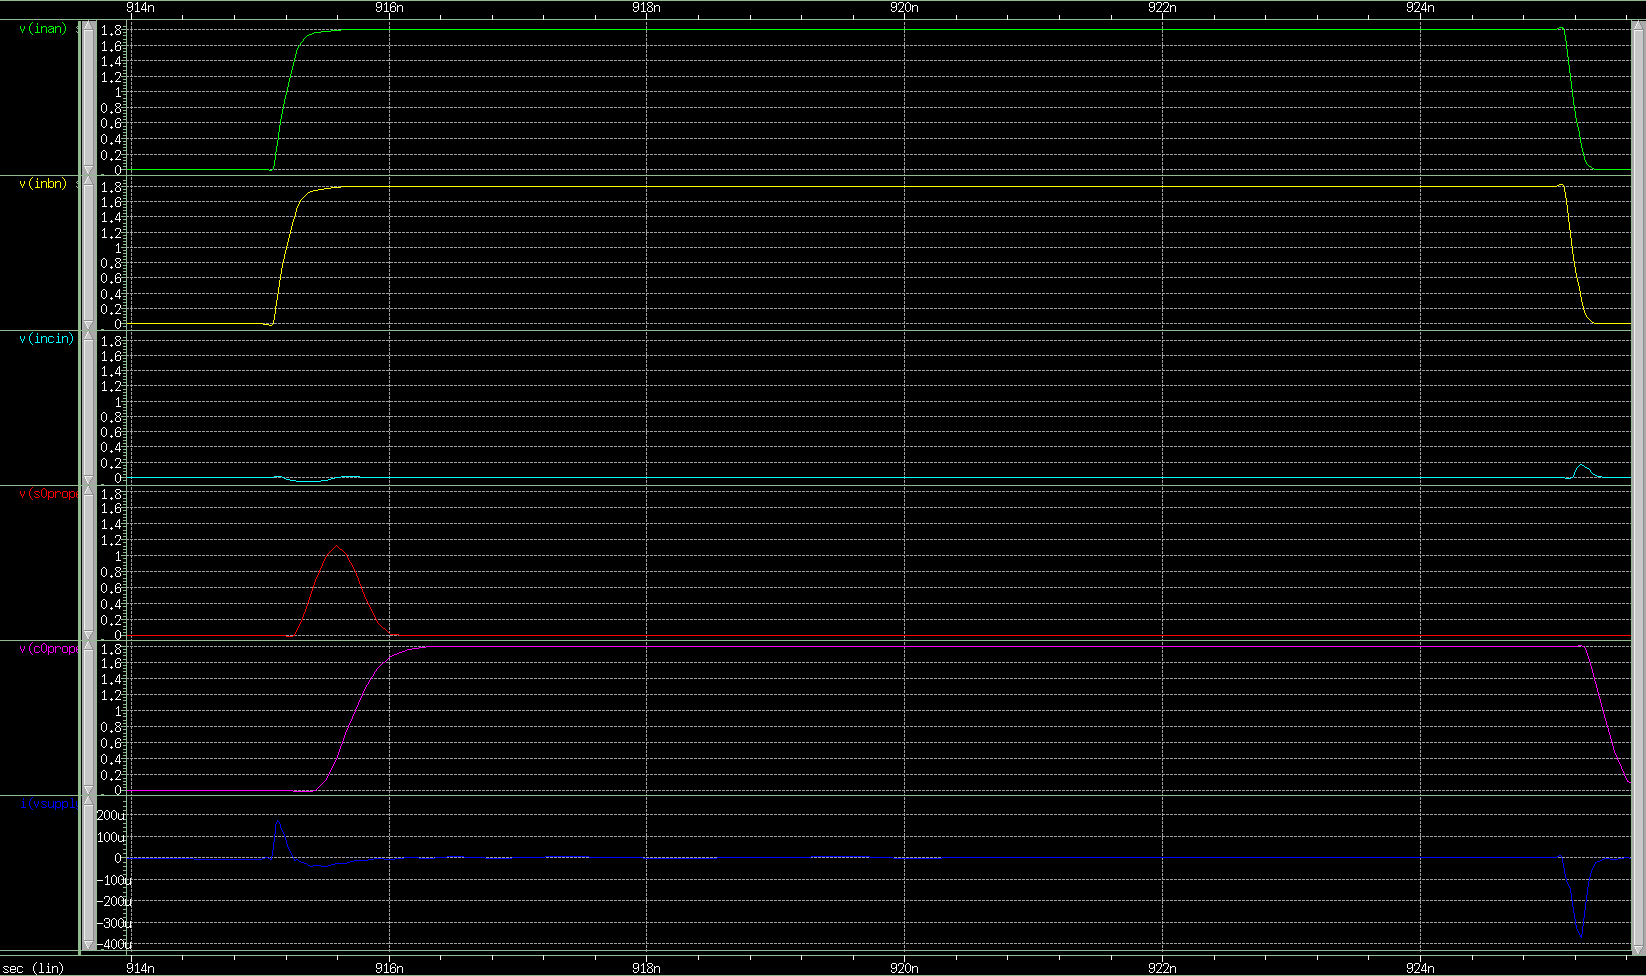
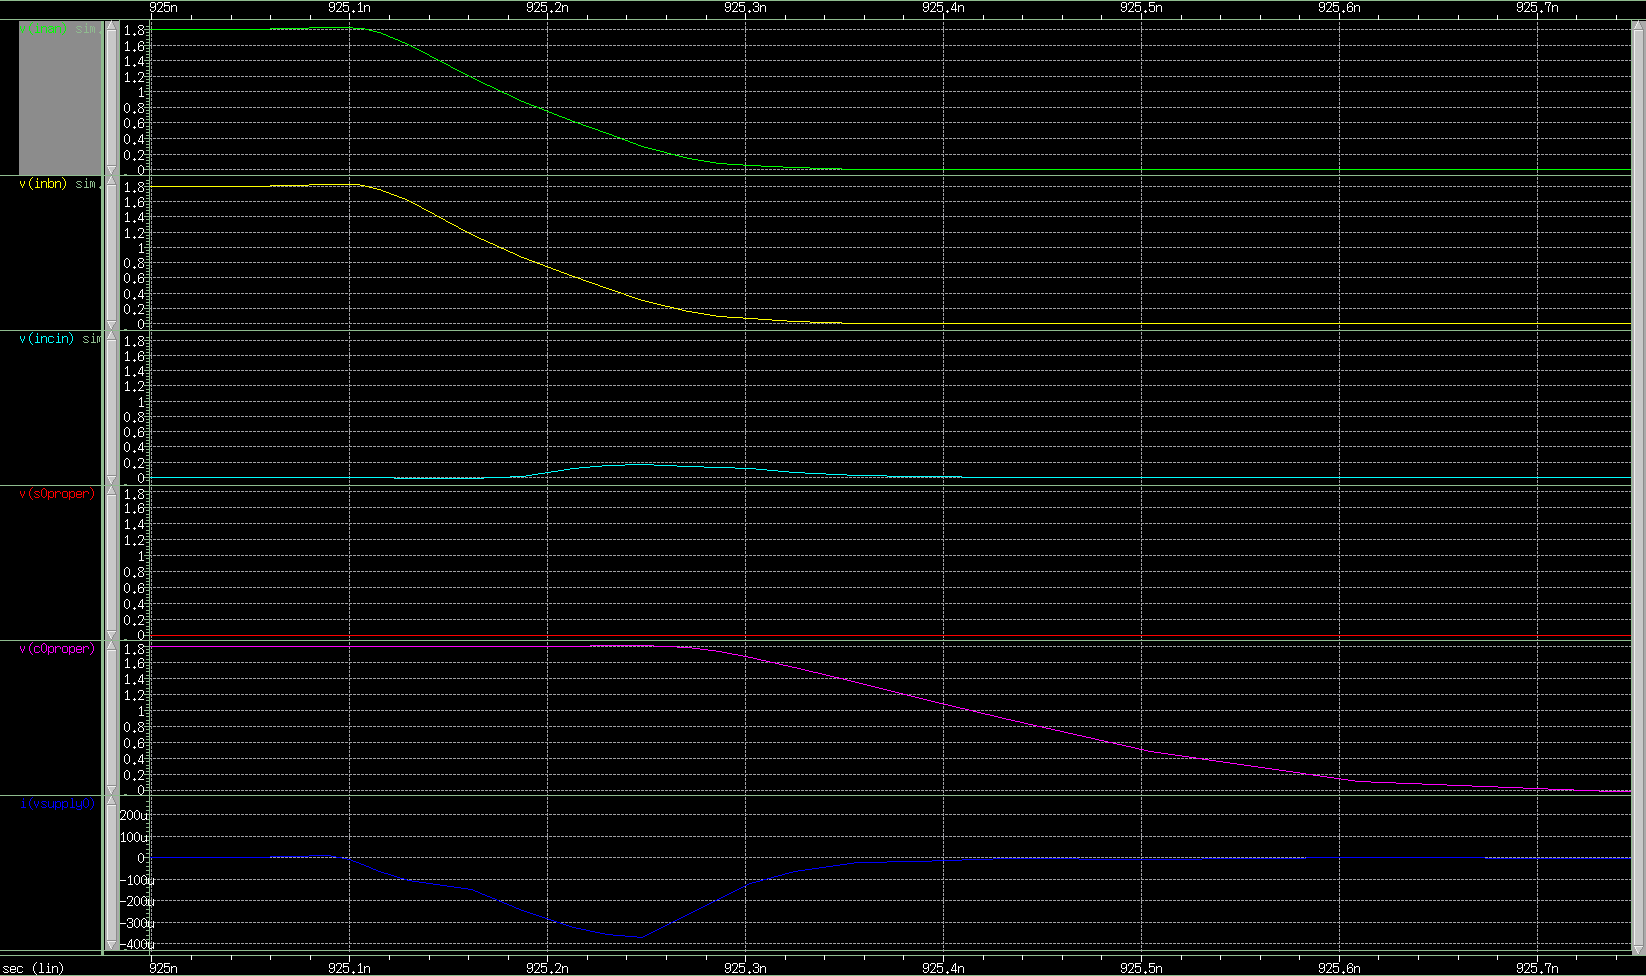
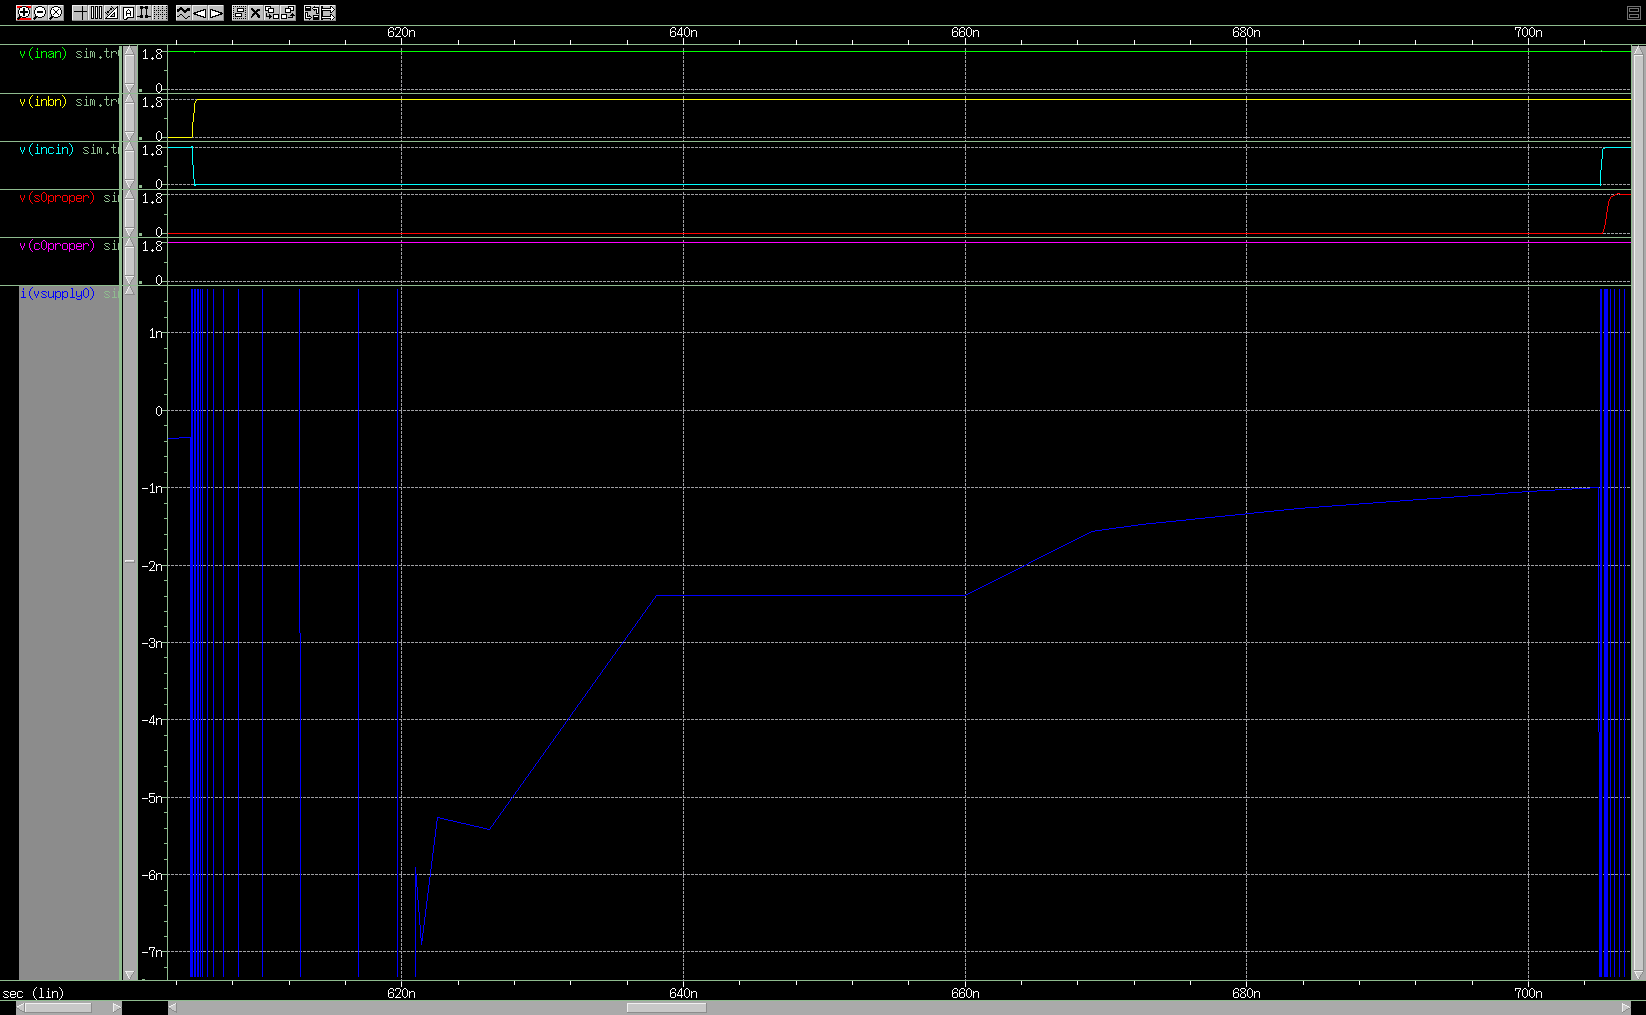
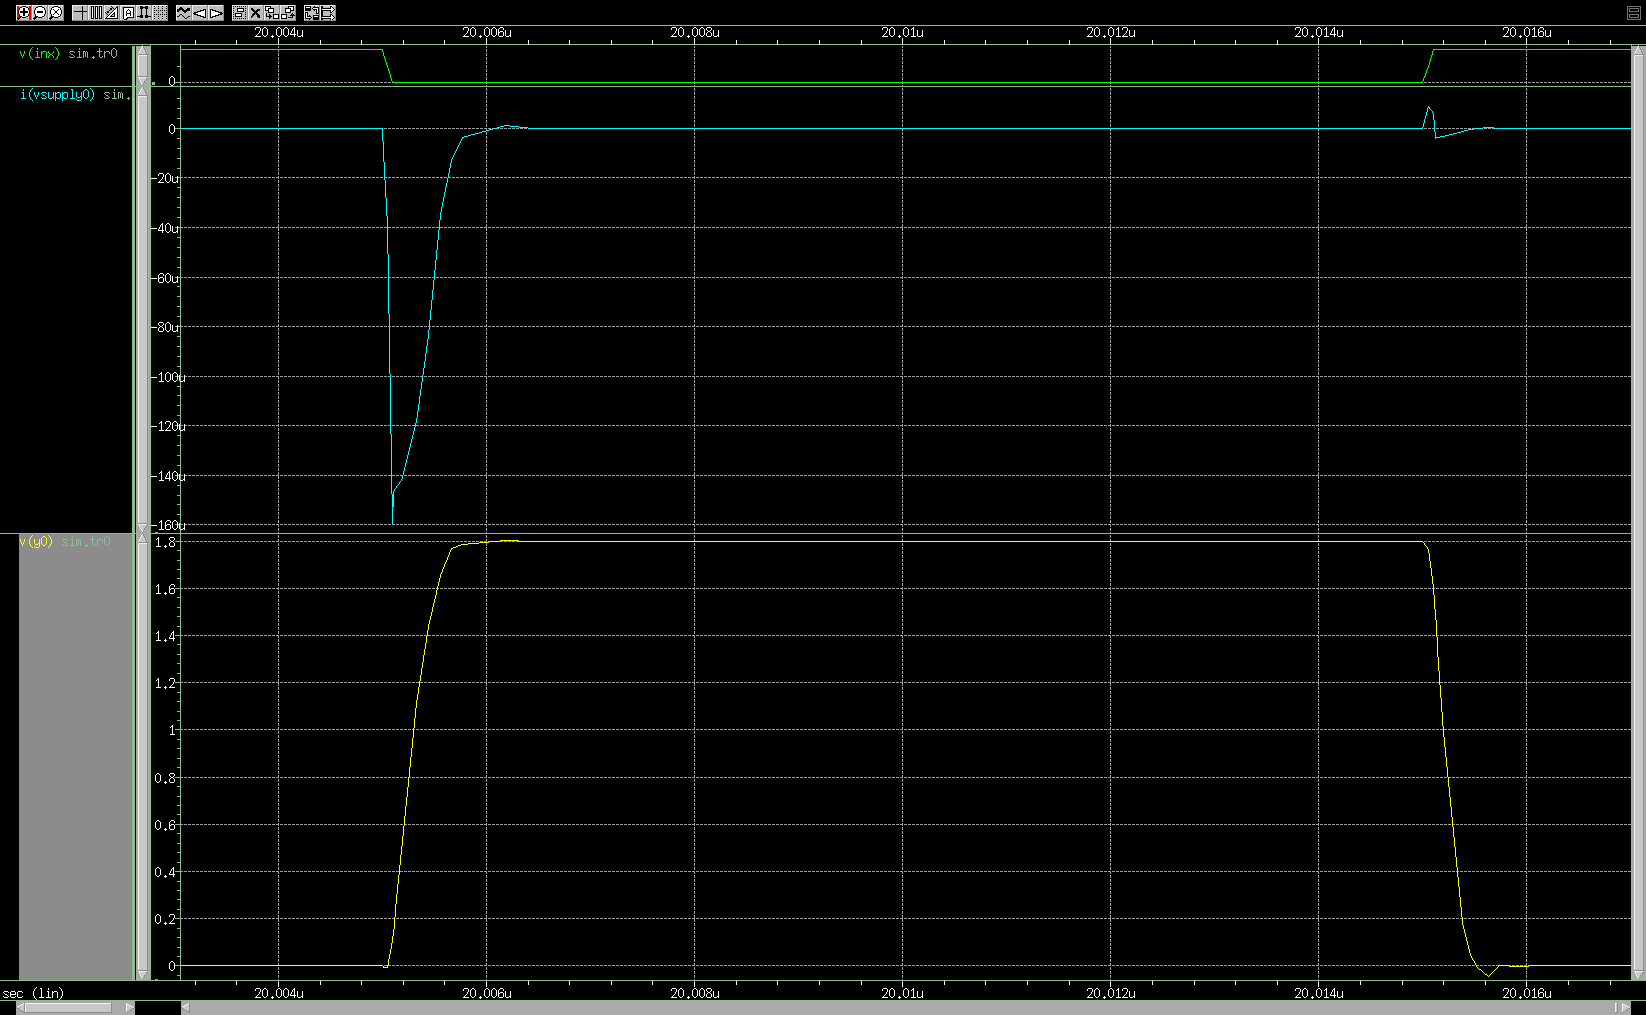
This is what the waveform looks like.
I use measurement statements to get the static current as Idd well clear of any input switching. I also use measurement statements to get the total current at each state transition by measuring 3/4 of a clock cycle prior to a transition to 3/4 of a clock cycle after a transition. Once I have all my measurements I calculate dynamic energy as total energy minus static energy.
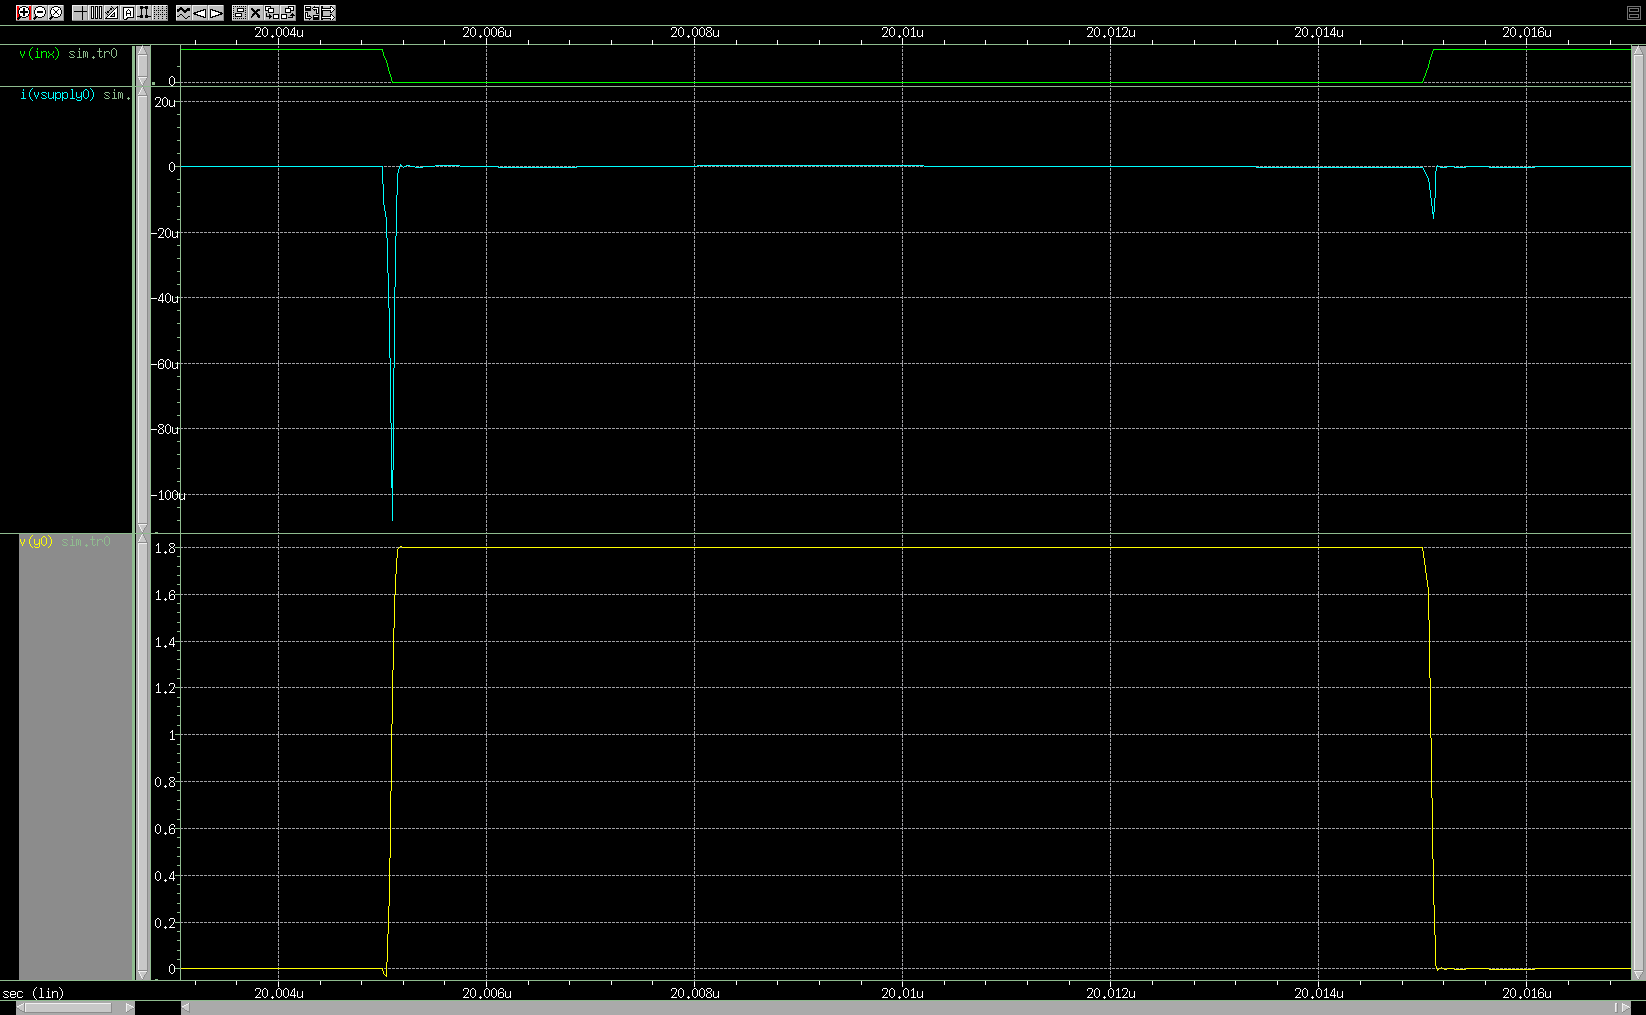
I must be doing something wrong, however. I've tried varying my clock cycle and I'm getting vastly different measurements for both dynamic and static power (as much as an order of magnitude in some cases). I've also seen ringing on Idd in some cases.
Is this setup correct? Do I have to use DC analysis to measure static power?
Any pointers or thoughts would be greatly appreciated.
My operating principal is total power consumption is a combination of static power and dynamic power.
Code:
Pt = Pd + Ps

where
Pt = Vdd * Idd
See https://users.ece.gatech.edu/~jeff/ece4420/powerlecture.pdf
The first cell I'm trying to characterize is a full adder. I want to calculate the static power consumption for all possible states (input combinations) and the dynamic power consumption for all possible state transitions.
Since I need to do several cells over several operating voltages I want to make all the calculations in a single run for each operating voltage. First I run my state transitions, then move to each state for an extended period of time to measure static current.
This is what the waveform looks like.
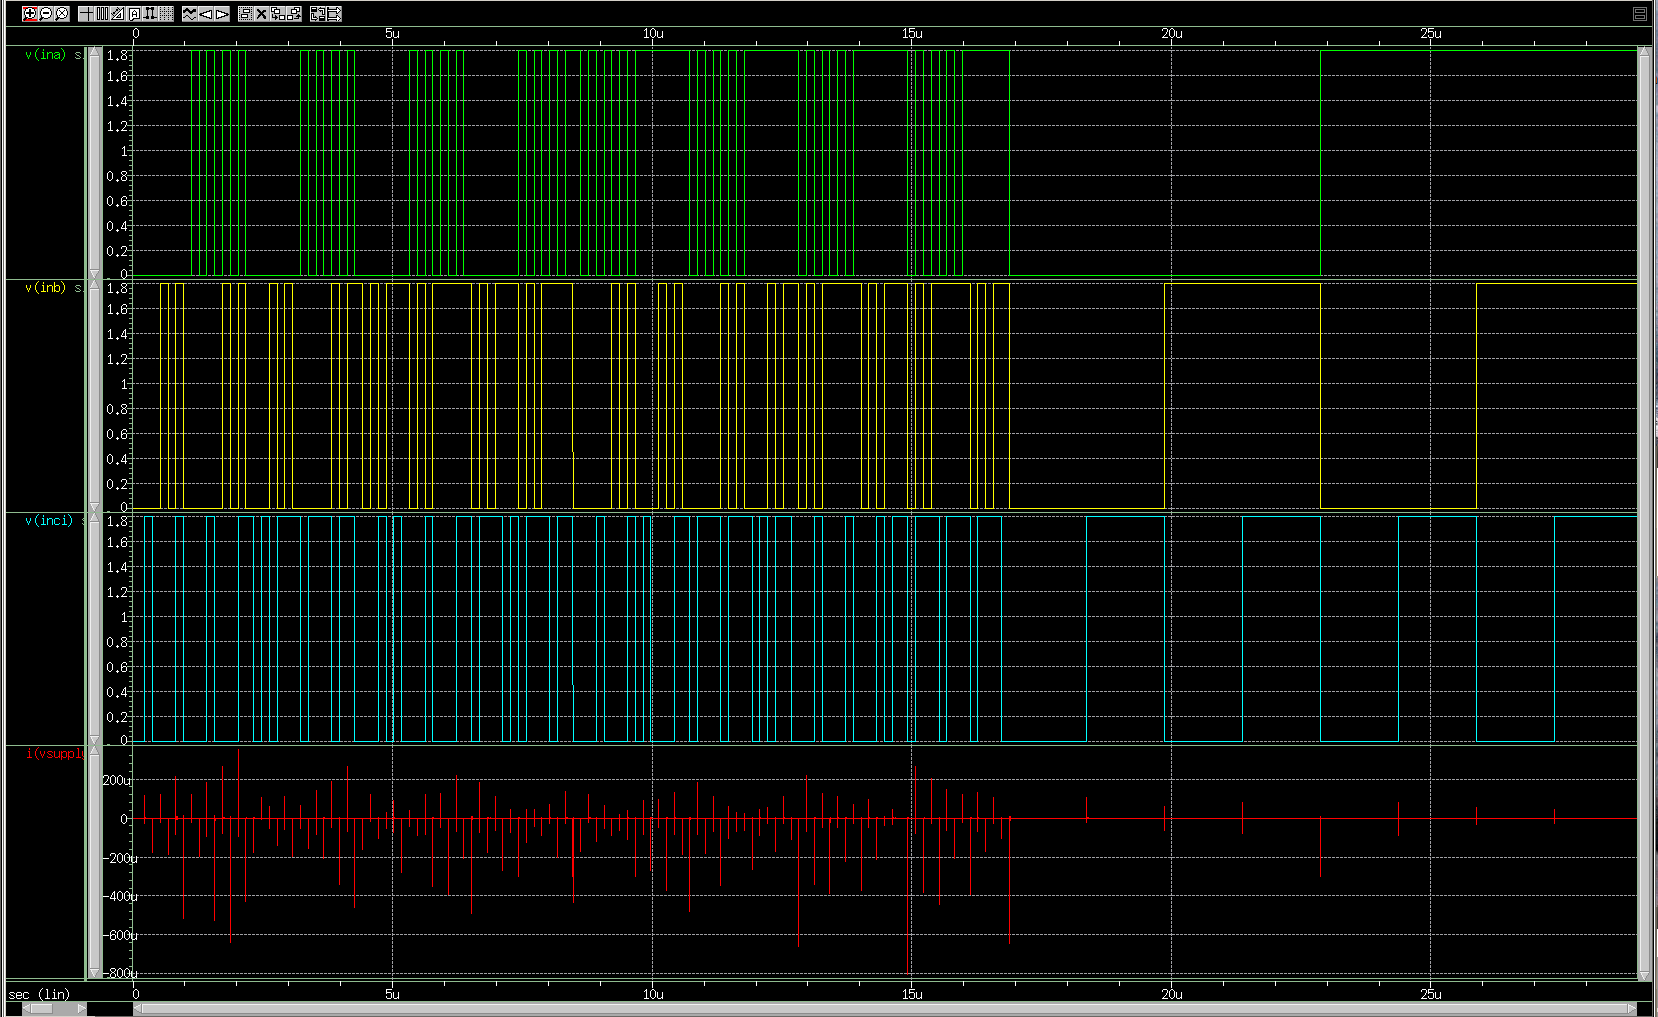
I use measurement statements to get the static current as Idd well clear of any input switching. I also use measurement statements to get the total current at each state transition by measuring 3/4 of a clock cycle prior to a transition to 3/4 of a clock cycle after a transition. Once I have all my measurements I calculate dynamic energy as total energy minus static energy.
Code:
Es = Vs * Is * T
Et = Vdd * Idd * T
Ed = Et - Es
Pd = Ed / t
I must be doing something wrong, however. I've tried varying my clock cycle and I'm getting vastly different measurements for both dynamic and static power (as much as an order of magnitude in some cases). I've also seen ringing on Idd in some cases.
Is this setup correct? Do I have to use DC analysis to measure static power?
Any pointers or thoughts would be greatly appreciated.