Continue to Site

Welcome to EDAboard.com

Welcome to our site! EDAboard.com is an international Electronics Discussion Forum focused on EDA software, circuits, schematics, books, theory, papers, asic, pld, 8051, DSP, Network, RF, Analog Design, PCB, Service Manuals... and a whole lot more! To participate you need to register. Registration is free. Click here to register now.

antenna radiation pattern(too urgent)

Status
Not open for further replies.

ksnls

Junior Member level 2
Joined
Mar 13, 2009
Messages
20
Helped
1
Reputation
2
Reaction score
1
Trophy points
1,283
Activity points
1,396
hii frns,
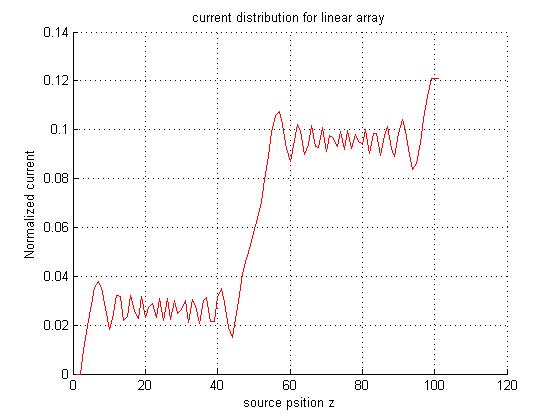
I require a code for current distribution of line source using woodward-lawson synthesis in matlab. That equation is in the 'Balanis' text book of antenna theory.

thanks
 

please upload all your equations, may be i can help you
 

I am sending you pdf file which contains current distribution equation for woodward lawson synthesis method for line source & linear array.
please go through that .if any require i will send you.

thanks
 

Hi Dear,

which equation number you need to plot?
 

I require it for equations

7-16,7-24 that means current disribution for array & source.


thanks
for your great response
 

sorry me friend, cos my response will be too late cos i must understand the material itself before any programming.

wait me please
 

k how much time it will take?
 

can you help me please? I need to know how to calculate the excitation factor bm.
 

I will send you wat program we write for that can tell me how to plot graph for source & array? I am geeting near graph for source but no graph for array :cry:
 

my friend, please note that i am poor in this field but i can help you in the programming only. Note, my interest is OFDM modulation. but i want to help you in the programming

Added after 3 minutes:

now i can calculate θm; M; Δ;
but i do not know the two factors bm and k

can you provide me these two factors ?
 

k friend . I require your help on programming . am sending you my program pls go through that.


This website is n't taking mfiles wat can i do
 

rar it or copy it and paste in this website
 

I attached rar file pls see that and must run all files in same directory.
 

r u asking in pogram. actually 'z' is element position
 

ok friend i get all your files. Give me some time to see it

Added after 26 minutes:

for the array plot:

your problem that make the plot not appeared is the x-axis dimensioning at line 56. If you delete the x-axis in the plot commandt to be plot(abs(AF)/N, 'r'); then you will see your plot.

try it right now.
for N=100,


please tell me is this what you want to get?
 

no frn . our required plot is same as fig 7.6 (a) current distribution in pdf file

Added after 1 minutes:

hey how got that plot pls give me code wat chages u made
 
as i see, you are taking the positive values of m. In other words you ignor the -M values in line code number 41 {for ii = 1 : col
mm = m(ii);}

because u let m=-M:M; your calculations are for the positive values of m (from 1 to M only in line code 41 to 49).

-----------------------------------------

for ii = 1 : col
mm = m(ii);
yy = cos_theta_m(mm, lambda, length, samples);
zz=z_m(mm,d,samples);
sum = sum + (bm(jj)*exp(-j*k*zz*yy));
jj = jj + 1;
AF(kk) = sum;
kk = kk + 1;
end

------------------------------------------
correct me if i am in wrong idea
 

for ii = 1 : col
mm = m(ii);
yy = cos_theta_m(mm, lambda, length, samples);
zz=z_m(mm,d,samples);
sum = sum + (bm(jj)*exp(-j*k*zz*yy));
jj = jj + 1;
AF(kk) = sum;
kk = kk + 1;
end


in the above program

m(ii) taking array value from -M:M
bcz ii is incremented upto 'col'

if u require full see that wrd in command window.

Added after 15 minutes:

hii frn did u get my point?
 

Hi Friend;

now i complete my checking for the source. It is correct.

Added after 2 hours 1 minutes:

in fact,

i checked your array program. It is seem no problems in the program. Just do the following

%---------------------------- Lets plot the results -----------

figure; grid; hold on;

plot(-M:M, abs(AF), 'r');
xlabel('source psition z');
ylabel('Normalized current');
title('current distribution for linear array');

but in fact your program has no problems but why its results not like that in the book.

I suggest to do the calculations of the program by hand (take a small number of samples) and plot it.

I did my best:cry:
 

Status
Not open for further replies.

Part and Inventory Search

Welcome to EDABoard.com

Sponsor

Back
Top