Continue to Site

Welcome to EDAboard.com

Welcome to our site! EDAboard.com is an international Electronics Discussion Forum focused on EDA software, circuits, schematics, books, theory, papers, asic, pld, 8051, DSP, Network, RF, Analog Design, PCB, Service Manuals... and a whole lot more! To participate you need to register. Registration is free. Click here to register now.

[SOLVED] [Moved][ HELP ] percent conversion

Status
Not open for further replies.

other-side-of-d-moon

Advanced Member level 4
Joined
Oct 18, 2010
Messages
100
Helped
3
Reputation
6
Reaction score
3
Trophy points
1,298
Activity points
1,961
Hi Guys

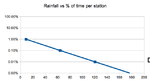
i attached a table contain Rainfall rate, i hope you to guide me to find the result at exceeded 100% of time.

appreciate your encourage

rain fall rate1.jpg
 

Re: [ HELP ] percent conversion

Hi there! As far as I know, for data such as this, we use interpolation techniques. One of the easiest ways is to form a polynomial where the independent variable would be the percentage and the dependent variable would be rainfall in mm/hr. The "Divided Difference Formula" or "Lagrange's Interpolation Formula" can help you out. Look into these and see if you can accurately apply them. If you are unable to do so, I shall help you out in the evening when I return home.

Humza.
 

Re: [ HELP ] percent conversion

Can you please describe this with example... ?

appreciated
 

Re: [ HELP ] percent conversion

Explaining it with an example will take quite some time. Read this link for more thorough information on Lagrange's formula. I shall provide you with the polynomial and the answer in just a while.

- - - Updated - - -

Here is a site where you can get a Lagrange polynomial based on data points you have. http://wood.mendelu.cz/math/maw-html/index.php?lang=en&form=lagrange

I have entered your data points and found out the polynomial for you. Find the entire working in the attached PDF file. You will find the final polynomial in there too. Simply put 'x' as 100 and you will have your desired answer.

View attachment lagrange.pdf
 
Re: [ HELP ] percent conversion

Explaining it with an example will take quite some time. Read this link for more thorough information on Lagrange's formula. I shall provide you with the polynomial and the answer in just a while.

- - - Updated - - -

Here is a site where you can get a Lagrange polynomial based on data points you have. **broken link removed**

I have entered your data points and found out the polynomial for you. Find the entire working in the attached PDF file. You will find the final polynomial in there too. Simply put 'x' as 100 and you will have your desired answer.

View attachment 75631

thanks alot hshah8970

last question for me please, its attached bellow. tx
q.JPG
 

Re: [ HELP ] percent conversion

You provided no other information about the data such as whether it is an increasing or decreasing function; so I shall assume it's a simple ratio-related question. If you divide x by 10, y should also be divided by 10 hence the new answer should be 0.87780.
 

Re: [ HELP ] percent conversion

You provided no other information about the data such as whether it is an increasing or decreasing function; so I shall assume it's a simple ratio-related question. If you divide x by 10, y should also be divided by 10 hence the new answer should be 0.87780.

hshah8970...

i need it increase Not decrease. sooooo what should i do??
 

Re: [ HELP ] percent conversion

Assuming that this is an increasing function with a constant rate of change, the value of y at x = 10 should be 87.780
 

Re: [ HELP ] percent conversion

I fear you didn't yet understand the meaining of the table data. I think, this are just empirical observations. Assuming it's not raining all the day, the rainfall rate exceeded for 100 % of time will be 0 mm/hr.

In addition, you can check if the given niumbers fit a gauss integral also called erf().

Hi sir FvM

I have the rainfall intensity of last month the city which i live in, ir was 55mm/hr. could you please tell me how can i get the rainfall exceeded 0.01% in average year ??

appreciated.
 
Last edited:

Re: [ HELP ] percent conversion

In my understanding, the table is based on a short time (e.g. hourly) recording of rainfall rate, as it can be obtaimed from a recording rainfall meter. This recordings are sorted and compiled to a cummulative statistic. You can't determine the missing points without having access to the real data recordings. Possibly a statistical model function can be fitted to it.

If it's a kind of exercise, I would expect a clearer problem specification.

P.S.: The said number of 55 mm/hr refers apparently to the highest rate observed. To make a frequency curve, you need all hourly observations of the respective period.
 
Last edited:
Re: [ HELP ] percent conversion

Thanks a loooooot hshah8970 & FvM

From the table above any one can tell me what is the rainfall intensity per hours (mm/hr) not time percent exceeded.

thank you
 

All numbers in the table have the meaning of rainfall intensity per hour.

Sorry but could you please be clear because i am not expert and still degree student. what is the meaning for each number and the important question is how to convert rainnfall intensity ( mm/hr ) to 0.01% of time in average year.

regards
 

I'm not an expert in meteorology, I'm just applying common sense to the problem.

The numbers in the table are indicating the frequency of extreme weather (violent rain). They don't tell about average rainfall and can't be converted to anything. Average rainfall rates are below 1 mm/hr for most regions.
 

Plotting the data so that you can extend it on a log scale helps in this situation so you can see the threshold of probability that crosses the intercept. It shows that non-events ( 0 rain occurs ) in less than 99% of the days recorded assuming these were daily events recorded.

Screen shot 2012-07-28 at 12.38.32 PM.png

This was done using free Open Office, Calc with X-Y plot then select Y axis >scale> logarithm, then menu > insert >Trend choosing Power option with Equation option and shown automatically.
 

Attachments

  • Screen shot 2012-07-28 at 12.26.25 PM.png
    Screen shot 2012-07-28 at 12.26.25 PM.png
    27 KB · Views: 95
Last edited:
  • Like
Reactions: FvM and jasonc2

    jasonc2

    Points: 2
    Helpful Answer Positive Rating

    FvM

    Points: 2
    Helpful Answer Positive Rating
It shows that non-events ( 0 rain occurs ) in less than 99% of the days recorded assuming these were daily events recorded.
Can the perfect exponential fit "show" anything about the number of no rain days? Only if we know that it's a "constructed" exercise problem, I think. Or if you know a physically plausible justification to extrapolate beyond the 0.001 to 1 % range.

Nevertheless, congratulation for revealing the exponential "law" behind the table data which shows a light on the nature of the problem.
 

Status
Not open for further replies.

Similar threads

Part and Inventory Search

Welcome to EDABoard.com

Sponsor

Back
Top