ianian12377
Newbie
Hi this is the amplifier I am currently designing and want to simulate the OIP3 at POUT 23 dBm,
From this figure, it can be known that when Pin = -13.8 dBm, Gain = 36.8 dB and Pout = 23dBm.

Use 2TONE on ADS and set Pin = -13.8 dBm.

Using the tool IP3out, the OIP3_lower and OIP3_upper can be obtained as 37.87 dBm and 39.79 dBm respectively

But I use the analog method of this picture to draw the picture:
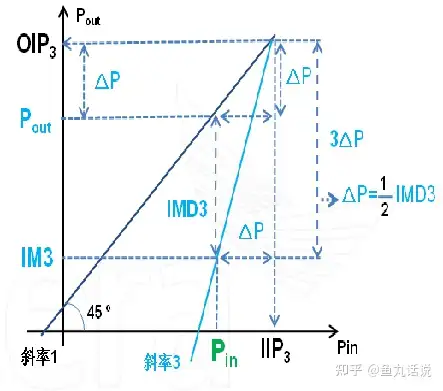

It can be known that: IM3_lower = -15.77, IM3_upper = -19.62


Draw the intersection points with slopes of 1 and 3, and find that the intersection points will be at 42.39, 44.31
Excuse me, why is there a difference between the junction point of self-drawing and the result of using ADS IP3out? Thank you very much
From this figure, it can be known that when Pin = -13.8 dBm, Gain = 36.8 dB and Pout = 23dBm.
Use 2TONE on ADS and set Pin = -13.8 dBm.
Using the tool IP3out, the OIP3_lower and OIP3_upper can be obtained as 37.87 dBm and 39.79 dBm respectively
But I use the analog method of this picture to draw the picture:
It can be known that: IM3_lower = -15.77, IM3_upper = -19.62
Draw the intersection points with slopes of 1 and 3, and find that the intersection points will be at 42.39, 44.31
Excuse me, why is there a difference between the junction point of self-drawing and the result of using ADS IP3out? Thank you very much