giorgi3092
Junior Member level 2
Hi,
I am working in AWR and realized a BPF with coupled microstrip lines.
So, I have two schematics:
a) Ideal (designed with AWR iFilter tool)

b) Realized with microstrip technology (values were optimized)

Now, here is the resulting graphs

dashed regions are optimization goals that were used for optimization. You can see that the transmission coefficient (S21) of the microstrip version (last red line) goes back up to 0 dB at the end of the graph. Meanwhile, the ideal version does not do that (pink line).
Can anyone explain to me why S21 goes back up to 0 dB at the end of the graph? What is the phenomenon at work? How can this be improved?
edit:
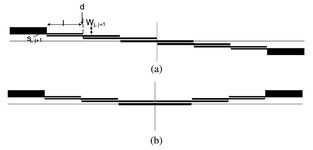
here's the layout as well

Thank you,
Giorgi
I am working in AWR and realized a BPF with coupled microstrip lines.
So, I have two schematics:
a) Ideal (designed with AWR iFilter tool)
b) Realized with microstrip technology (values were optimized)
Now, here is the resulting graphs
dashed regions are optimization goals that were used for optimization. You can see that the transmission coefficient (S21) of the microstrip version (last red line) goes back up to 0 dB at the end of the graph. Meanwhile, the ideal version does not do that (pink line).
Can anyone explain to me why S21 goes back up to 0 dB at the end of the graph? What is the phenomenon at work? How can this be improved?
edit:
here's the layout as well
Thank you,
Giorgi