Mustaine
Member level 1
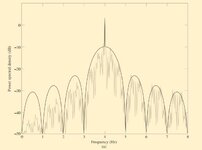
Hello friends i am trying to plot the PSD of BASK in MATLAB.
the specifications of the signals as follows:
Number of data bits (1s and 0s) = 100
Sampling frequency fs = 100 Hz
Number of data points (samples) = 100*fs = 10 000 data points
block size of FFT, N = 4096
Bit duration Tb = 1s
Carrier frequency fc = 4 Hz
The matlab code i wrote (incomplete) as follows:
i could not specify the incoming binary wave whose amplitude is sqrt(Eb) and 0 for binary 1 and 0 respectively.
the outcome should be as follows
the example is taken from an introduction to analog and digital communication by moher and simon.
thanks in advance
the specifications of the signals as follows:
Number of data bits (1s and 0s) = 100
Sampling frequency fs = 100 Hz
Number of data points (samples) = 100*fs = 10 000 data points
block size of FFT, N = 4096
Bit duration Tb = 1s
Carrier frequency fc = 4 Hz
The matlab code i wrote (incomplete) as follows:
Code:
f_sampling=100;
t=0: 1/f_sampling: 1-1/f_sampling;
fc=4;
Tb=1;
Ac=sqrt(2/Tb);
c=Ac*cos(2*pi*fc*t);
i could not specify the incoming binary wave whose amplitude is sqrt(Eb) and 0 for binary 1 and 0 respectively.
the outcome should be as follows
the example is taken from an introduction to analog and digital communication by moher and simon.
thanks in advance