Continue to Site

Welcome to EDAboard.com

Welcome to our site! EDAboard.com is an international Electronics Discussion Forum focused on EDA software, circuits, schematics, books, theory, papers, asic, pld, 8051, DSP, Network, RF, Analog Design, PCB, Service Manuals... and a whole lot more! To participate you need to register. Registration is free. Click here to register now.

Nosie in FSK constellation

Status
Not open for further replies.

SherlockBenedict

Member level 4
Joined
Dec 26, 2011
Messages
77
Helped
0
Reputation
0
Reaction score
0
Trophy points
1,286
Activity points
1,870


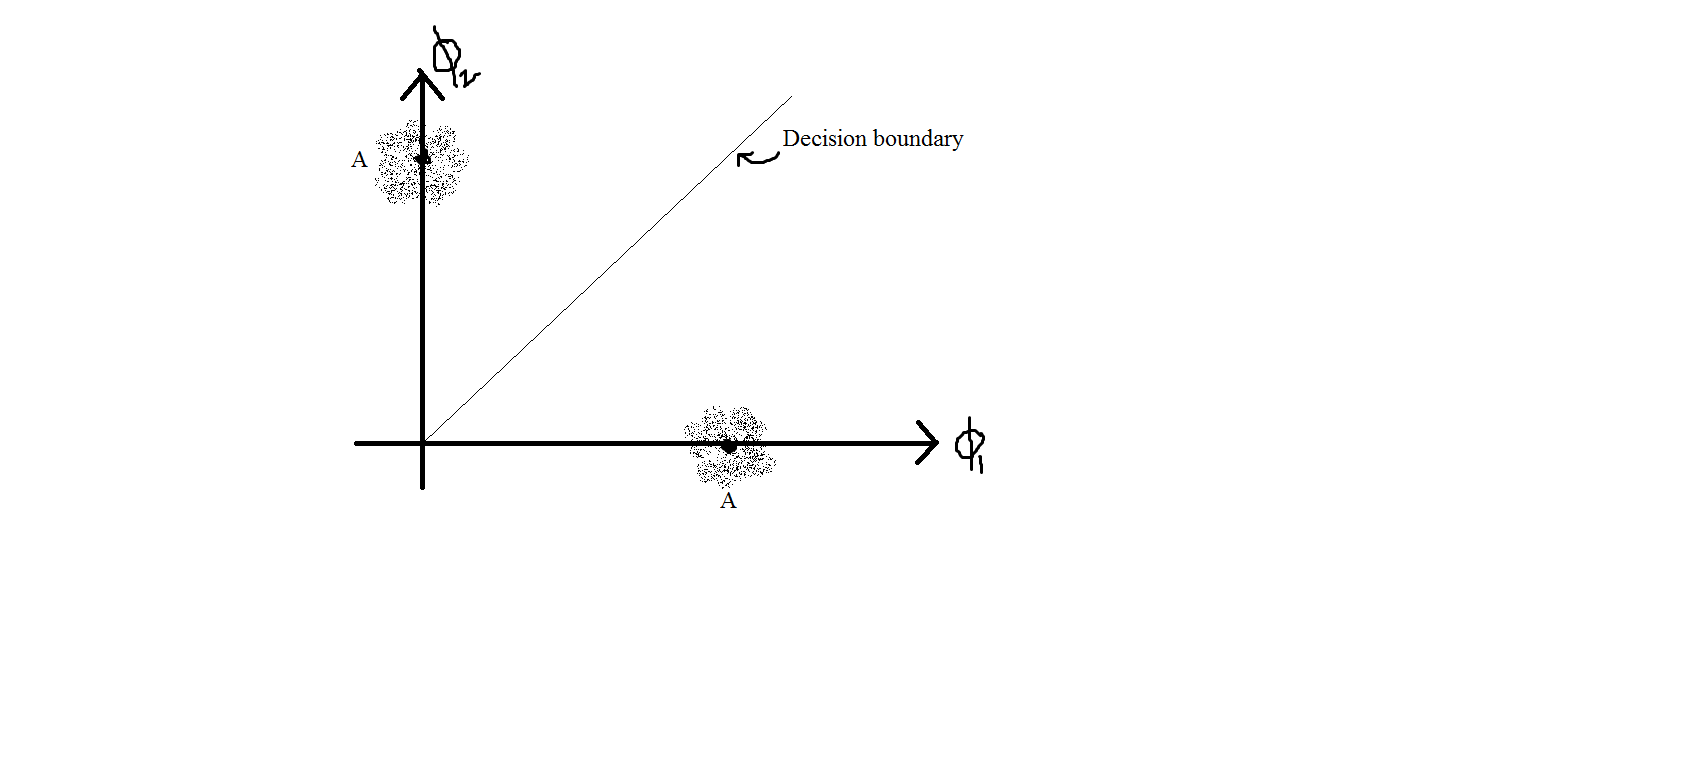
What does the noise in FSK constellation indicate? I mean you can see those clusters near the amplitude. Do they indicate a change in the frequency ??

Note that Φ1 and Φ2 are the basis function (which in this case is going to be two different frequencies that are orthogonal to each other) and 'A' is the amplitude.

Thanks in advance.
 

The noise in that graph looks like simple Additive White Gaussian Noise (AWGN). The source of such noise comes from various sources, including imperfections in the real RF components, the weather, etc. Because the sources are small, numerous, and unpredictable, the noise is just modeled as having a distribution of a Gaussian random variable around the constellation point. These small points in the cluster indicate the received signal after going through the noisy channel.

Oftentimes the noise is relatively constant in the environment, but the received signal power can vary (depending on the location of the transmitter). The relative difference between the received signal power can lead to a significant increase in the noise you see in the constellation (low received signal power will give a larger cluster around the constellation point).
 

Shug I know that that is AWGN. The question what do they indicate in the above diagram. It doesn't look like the change in the amplitude as we usually see in PSK constellations. It looks more like change in the frequency (as you can infer from the above diagram). That's my question. I want to know whether it is right or wrong.
 

Shug I know that that is AWGN. The question what do they indicate in the above diagram. It doesn't look like the change in the amplitude as we usually see in PSK constellations. It looks more like change in the frequency (as you can infer from the above diagram). That's my question. I want to know whether it is right or wrong.

Complex AWGN affects both amplitude and phase/frequency. Remember that when you add complex Gaussian noise, the value you add is, in fact, complex; thus, both values will change.

If, for example, you added only real AWGN, you would see only the real component in the signal change, so the clusters would not be circular, but rather horizontal lines. If you added only imaginary AWGN, you would see the imaginary component change, so the clusters would be horizontal lines.
 

Status
Not open for further replies.

Similar threads

Part and Inventory Search

Welcome to EDABoard.com

Sponsor

Back
Top