thedean515
Newbie level 3
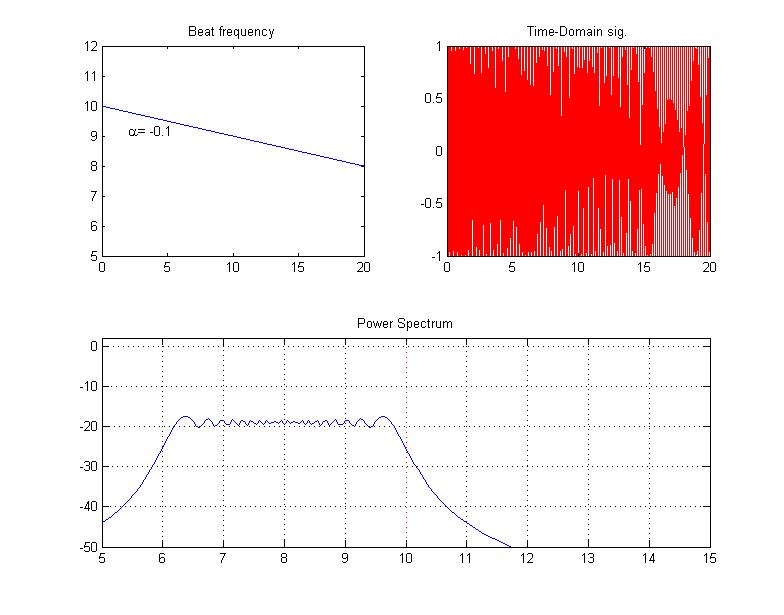
The time domain signal is defined as:\[
y\left(t\right)=A\cos\left(2\pi\left(f_{0}-\alpha t\right)t\right),\]
where A=1, \[f_{0}=10\] and \[\alpha=0.1\], I take 4096 data samples
in the total period T=20 sec, which the sampling frequency is
about 205 Hz.
f0 = 10;
N = 2^12;
t = linspace(0,20,N); NFFT = 2^nextpow2(N);
fs = 1/(t(2)-t(1));
a = 0.1;
ff = f0 - a*t;
y = cos(2*pi*ff.*t);
Y = fft(y,NFFT)/N; f = fs/2*linspace(0,1,NFFT/2+1);
subplot(221); plot(t,ff); ylim([5,12]); text(2,9.2,['\alpha=',num2str(a)]);
title('Beat frequency');
subplot(222); plot(t,y,'r-'); title('Time-Domain sig.')
subplot(212);
plot(f,20*log10(2*abs(Y(1:NFFT/2+1)))); xlim([5,15]); ylim([-50,2]);
% plot(f,2*abs(Y(1:NFFT/2+1))); % xlim([0,15]); ylim([-50,2]);
title('Power Spectrum')
vline(f0); grid on;

Am I right in thinking that there are shouldn't be any frequency contents below 8 Hz, but why the spectrum contradict the thinking, moreover, the spectrum is oddly symmetrical.
Would you please help me to find out where I have done wrong or can you confirm this is the correct numerical simulation to this problem.
Cheers!![/img]
y\left(t\right)=A\cos\left(2\pi\left(f_{0}-\alpha t\right)t\right),\]
where A=1, \[f_{0}=10\] and \[\alpha=0.1\], I take 4096 data samples
in the total period T=20 sec, which the sampling frequency is
about 205 Hz.
f0 = 10;
N = 2^12;
t = linspace(0,20,N); NFFT = 2^nextpow2(N);
fs = 1/(t(2)-t(1));
a = 0.1;
ff = f0 - a*t;
y = cos(2*pi*ff.*t);
Y = fft(y,NFFT)/N; f = fs/2*linspace(0,1,NFFT/2+1);
subplot(221); plot(t,ff); ylim([5,12]); text(2,9.2,['\alpha=',num2str(a)]);
title('Beat frequency');
subplot(222); plot(t,y,'r-'); title('Time-Domain sig.')
subplot(212);
plot(f,20*log10(2*abs(Y(1:NFFT/2+1)))); xlim([5,15]); ylim([-50,2]);
% plot(f,2*abs(Y(1:NFFT/2+1))); % xlim([0,15]); ylim([-50,2]);
title('Power Spectrum')
vline(f0); grid on;
Am I right in thinking that there are shouldn't be any frequency contents below 8 Hz, but why the spectrum contradict the thinking, moreover, the spectrum is oddly symmetrical.
Would you please help me to find out where I have done wrong or can you confirm this is the correct numerical simulation to this problem.
Cheers!![/img]
Last edited by a moderator: