Continue to Site

Welcome to EDAboard.com

Welcome to our site! EDAboard.com is an international Electronics Discussion Forum focused on EDA software, circuits, schematics, books, theory, papers, asic, pld, 8051, DSP, Network, RF, Analog Design, PCB, Service Manuals... and a whole lot more! To participate you need to register. Registration is free. Click here to register now.

Need your DSP/FFT expertise

Status
Not open for further replies.

rush3k

Member level 1
Joined
Mar 31, 2006
Messages
38
Helped
8
Reputation
16
Reaction score
0
Trophy points
1,286
Activity points
1,507
compute cutoff frequency

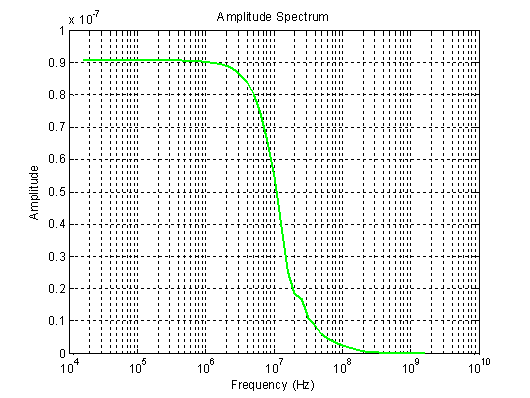
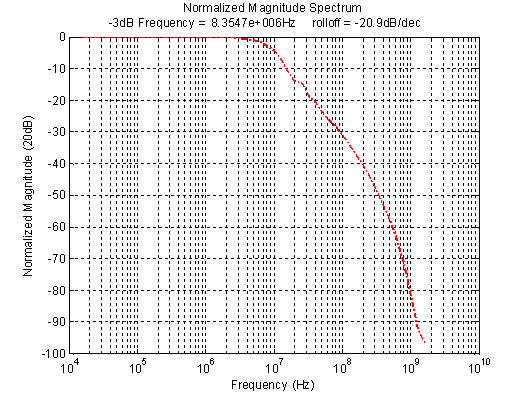
The pictures are of my FFT. I use it to extract the -3dB frequency. Also use it for the -3db to -6dB rolloff slope, not sure if this of much use yet.

I'm wondering what other ways you guys out there use the FFT. What other information can you glean from the amplitude, magnitude and even phase data?


84_1204395272.png


92_1204395135.png
 

Pictures present Bode plot (and not FFT) of a bypass filter. The frequency that you extracted at -3db presents the cut-off frequency of the filter.
 

supiper said:
Pictures present Bode plot (and not FFT) of a bypass filter. The frequency that you extracted at -3db presents the cut-off frequency of the filter.

So what information do you get from your Bode plot, that was my question.
 

rush3k said:
supiper said:
Pictures present Bode plot (and not FFT) of a bypass filter. The frequency that you extracted at -3db presents the cut-off frequency of the filter.

So what information do you get from your Bode plot, that was my question.

Bode plots are used to assess the stability of negative feedback amplifiers by finding the gain and phase margins of an amplifier, see this link:
https://en.wikipedia.org/wiki/Bode_plot#Gain_margin_and_phase_margin
 

Dear both are frequency responses. The first one is 20*log|H(ω)| against Frequency (Hz) and second one is normalized by max(20*log|H(ω)|).

If u want to compute cutoff frequency for this system then use normalized one.
Second plot is generated using two arrays say H along y-axis and f along x-axis i.e plot(f,H)

How you can compute -3dB cutoff:

x=find(H<=-3);
Cutoff=f(X(end)) \]
 

the diagrams is confuse me
 

Status
Not open for further replies.

Similar threads

Part and Inventory Search

Welcome to EDABoard.com

Sponsor

Back
Top