engr_joni_ee
Advanced Member level 3
Hi,
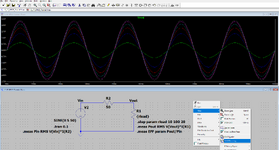
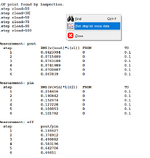
I have simulated a simple circuit and have added .step command which changes the values of output resistor. I added .meas command to measure RMS of input power and output power and efficacy. I got the values in the SPICE error log file but how there is a way to plot them. I tried right click and the error log and select the Plot step’ed .meas data but this does not work. Any idea how to plot ?
I have simulated a simple circuit and have added .step command which changes the values of output resistor. I added .meas command to measure RMS of input power and output power and efficacy. I got the values in the SPICE error log file but how there is a way to plot them. I tried right click and the error log and select the Plot step’ed .meas data but this does not work. Any idea how to plot ?