Continue to Site

Welcome to EDAboard.com

Welcome to our site! EDAboard.com is an international Electronics Discussion Forum focused on EDA software, circuits, schematics, books, theory, papers, asic, pld, 8051, DSP, Network, RF, Analog Design, PCB, Service Manuals... and a whole lot more! To participate you need to register. Registration is free. Click here to register now.

FFT calculation for sample and hold circuit in cadence virtuoso?

Status
Not open for further replies.

parminder

Member level 2
Joined
Mar 1, 2022
Messages
53
Helped
0
Reputation
0
Reaction score
0
Trophy points
6
Activity points
377
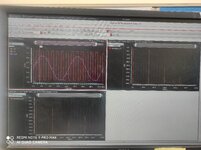
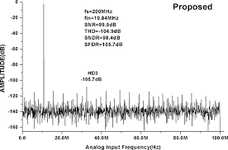
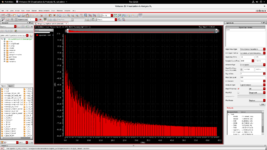
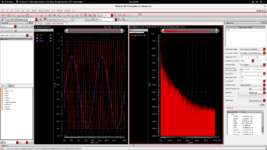
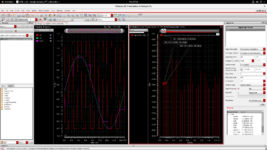
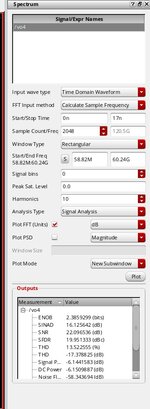
i am trying to plot FFT spectra of bootstrap switch Sample and hold circuit, i have got the fundamental frequency and harmonics distortion components in the graph. i want my graph like 2nd image but i am not getting noise. can anyone please help me out where am i making mistake?

Fin= 50Mhz
Fs= 500Mhz
 

Attachments

  • 1646047264447.jpg
    1646047264447.jpg
    8.2 MB · Views: 335
  • download.png
    download.png
    7.5 KB · Views: 323

Hello,

Next time please use the PC's screenshot feature to generate a .png file.
While this is maybe just 1/50 of your file size it gives perfect quality.

To your problem.
It looks like a simulation with almost perfect situations.
Thus you don't get noise in the meaning of noise floor, you just get overtones.

In a real circuit you will get noise caused by semiconductors and resistors, also you get noise caused by jitter of the digital control signals, and you get some more "noise floor looking" noise when the input signal is a clean sine but a more complex signal.

Also mind that your FFT output goes just down to about -40dB, while the other chart goes down to -140dB. The difference in 100dB means a favtor of 1/100,000 in voltage.

As an example:
If -40dB means 10mV, then -140dB means 0.1uV.

Klaus
 
Last edited:

Thank you klaus for the response,

well 2nd plot has output -140 db because of the difference in selecting input signal amplitude. My main concern is with the noise floor. Why i am not getting sharp spikes of harmonic distortion. Noise and harmonic distortion are looking same?

can you please help me out with this?
 

Attachments

  • Screenshot from 2022-03-01 12-16-15.png
    Screenshot from 2022-03-01 12-16-15.png
    265.3 KB · Views: 318

Hi,

Now you show a completely different FFT output.
I wonder what's the signal (time domain) to this FFT plot is.

I guess the full window in time is not an integer multiple of input signal period and sampling signal period time.
If you can't guarantee integer multiple then you need to run a windowing function before running the FFT.

You only get perfect FFT output on "integer multiples" of period time.
The windowing function is a compromise, it lowers noise floor but also causes "sharp output" to become wider (in frequency), it more looks like a pyramid.

Klaus
 

in one of razavi's paper it is written that "If fCK is an integer multiple of fin, then the circuit samples only certain points on the input waveform"
For example, with f CK / fin = 5GHz / 570 Hz = 500/ 57, the sampled points repeat themselves after every 500 clock cycles; i.e., 500 distinct points of the input voltage are collected.

That is why i am not selecting integral multiple.
please check the transient response of output signal.

can you please tell me about windowing function?
 

Attachments

  • Screenshot from 2022-03-01 12-49-30.png
    Screenshot from 2022-03-01 12-49-30.png
    244.9 KB · Views: 266

Hi,

do you want to run an FFT or do you want many many points of a signal using downsampling scheme?

I´m worried:

you say 5GHz and 570Hz this is a ratio of 8,771,929 : 1
Are you sure this is correct?

Also your picture shows a sine period time of about 17ns this equals to about 59MHz.

I´m really confused by your numbers, they don´t fit to the pictures.


Klaus
 

5 G Hz and 570 Hz was just an example. For my case fin = 59 Mhz and fs= 500Mhz and I only want to run the FFT. May be i am making mistake somewhere . Please correct me where i am wrong. when i zoom the spectrum i get Ist component is at fundamental frequency ( 58.5MHz ) and 2nd component is lying at (119.6 MHz i.e 2 fin). However after first fundamental component, i would get 3rd harmonic at 3fin with sharp spike and in between of fin and 3 fin, all component would have smaller spike.

if above said content is wrong then please help with correct one.

Thanks
 

Attachments

  • Screenshot from 2022-03-01 17-13-21.png
    Screenshot from 2022-03-01 17-13-21.png
    278.5 KB · Views: 191

Hi,

In post#4 I talked about period time of signal and
FFT "full window in time".
I still don´t know what´s your time window of the FFT is
(or in other words: how many points (samples) is the FFT)

and what´s the S/H frequency?

Klaus
 

Are you taking about this window. if yes then please check points and time.
--- Updated ---

and sampling frequency is fs= 500Mhz, i am working in 65 nm technology
 

Attachments

  • sc1.jpg
    sc1.jpg
    72.5 KB · Views: 202
Last edited:

Hi,

it´s getting even more confusing.

The new picture shows a sampling frequency of 120.5GHz and a window size of 2048 samples.
Two new numbers!

And now the values of your post#7 make no sense, too.
I can only guess that:
* 58.5MHz should be 58.8MHz
* 119.6MHz should be 117.7MHz

But with all that guessing we don´t make progress, it´s more a waste of time. A step forward, a step back.

--> please focus on your application. Give true, matching values. Verify them before sending the post.
Explain the values.

Klaus
 

You have to set up the FFT correctly. You don't fix your Fin arbitrarily. It has to have integer number of periods within the time of your FFT points N. Otherwise you get garbage. So, the number of FFT points N and the number of input sine periods have to be mutually prime. Thus
Fin = (cycles/N)*Fs

For example if you choose N=512 and one period i.e. cycles=1, you get Fin=976.5625KHz
For cycles=3, N=512, Fin=2.9296875MHz
and so on.

The input frequency has to be exact and as the formula says. Otherwise you won't get good spectrum.

Fix the first point of your FFT window, say slightly before the end of your hold period. Then every next point is 1/Fs apart until you complete all of your N FFT points. This should result in the N+1 point being at the same voltage level as the 1st point. This will cause no spectral leakage.
 
Also, after setting the N (better to choose power of 2's and long ~ 256 or 512), and the coprime integer M for input, Fin = M/N * Fclk.
The simulation needs to run for sufficient time.
Total sim time = initial time + N/Fclk.

Initial time is just to ignore some of the points in the beginning.

In the FFT window, use start time = initial time, end time = total sim time, sample count = N as chosen, and freq should update as Fclk.
Check the Start/end frequency (click S) : Fclk/N and end frequency = bandwidth = Fclk/2.
and plot.
 

Status
Not open for further replies.

Part and Inventory Search

Welcome to EDABoard.com

Sponsor

Back
Top