Kabz
Newbie level 1
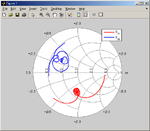
I am completely new to this. I have a .s2p file, and i need to plot them into a smith chart. there are 10006 values, and i do not know how to do this. Can someone please tell me how to, and give me the code. i need a little bit of coaching as i have never done this before so i need a little guidance. please please help. Thanks in advance!