eng.amr2009
Junior Member level 3
Guys,
I'm working on a filter design where the filter is modeled in Z-domain. I'm building the filter in simulink using basic elements and editing the fixed point data widths to prepare for RTL implementation.
The problem is I do not know the rules to set the width of integrator output as the integrator will overflow anyway. The effect of the fixed point width of the integrator on transfer function is unknown to me. I always worked using fdatool and did not experience this headache.
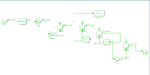
However, I built the filter using simulink. I need a way to be able to plot the transfer function of the filter built in simulink using basic elements so that I can compare to intended frequency response so that I can tweak my fixed point parameters to minimize discrepancy against intended transfer function.
The attached screenshot is for the filter implementation. The fixed point data is not finalized yet.
I'm working on a filter design where the filter is modeled in Z-domain. I'm building the filter in simulink using basic elements and editing the fixed point data widths to prepare for RTL implementation.
The problem is I do not know the rules to set the width of integrator output as the integrator will overflow anyway. The effect of the fixed point width of the integrator on transfer function is unknown to me. I always worked using fdatool and did not experience this headache.
However, I built the filter using simulink. I need a way to be able to plot the transfer function of the filter built in simulink using basic elements so that I can compare to intended frequency response so that I can tweak my fixed point parameters to minimize discrepancy against intended transfer function.
The attached screenshot is for the filter implementation. The fixed point data is not finalized yet.