Continue to Site

Welcome to EDAboard.com

Welcome to our site! EDAboard.com is an international Electronics Discussion Forum focused on EDA software, circuits, schematics, books, theory, papers, asic, pld, 8051, DSP, Network, RF, Analog Design, PCB, Service Manuals... and a whole lot more! To participate you need to register. Registration is free. Click here to register now.

Multisim Question. Why it displays Ic (uA) as V (mA)?

Status
Not open for further replies.
Joined
Dec 4, 2012
Messages
4,280
Helped
822
Reputation
1,654
Reaction score
791
Trophy points
1,393
Location
Bangalore, India
Activity points
0
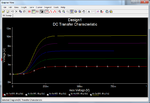
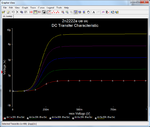
Multisim Question. Why it displays Ic (uA) as V (mV)?

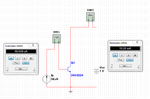
I am trying to simulate BJT CE output characteristics using Multisim. The problem is in the simulation graph the Ic (uA) is shown as V (mV). Why? How to make it show Ic (uA) for the
y - axis?

The plot of values are ok and it shows Vce for x - axis but problem is y - axis label. I am attaching multisim file.

95570d1378054610-bjt-ce-oc.png
 

Attachments

  • 2n2222a ce oc.rar
    42.4 KB · Views: 43
  • bjt ce oc.png
    bjt ce oc.png
    58.3 KB · Views: 82

You can edit the labels by double clicking it.
 

I know that I can edit the label but it only changes the label. The y-axis values 0 m, 3 m, 5 m, etc... doesn't change. It has to display 0 uA, 10uA, 20uA, ... 50uA.
 

This is from one of the examples. Y-axis will show Ic(mA) against Vce(V) for different (steps) of base currents.
 

Attachments

  • dc.gif
    dc.gif
    8.1 KB · Views: 81
Last edited:

It is a bug of Multisim. I eneterd range as 10 nA to 50 nA and it shows as uA. I hope NI will fix the bug. The values displayed are wrong. For 10 uA to 50 uA (entered as 10 nA to 50 nA) it shows upto 10 uA the whole range.

95578d1378062320-bjt-ce-oc-2.png
 

Attachments

  • bjt ce oc 2.png
    bjt ce oc 2.png
    59.6 KB · Views: 59

Is the auto axis scaling feature enabled?
 

Normally under "Graph - Properties - Axis" Click "Auto-range" and see if it makes a difference.
 

Oops. There was a mistake. The values 10 uA, 20 uA, ... 50uA are base currents which are not plotted. Actually the graph is right. It is plotting Ic vs Vce. Ic is 0 to 10 uA. The only problem is nA = uA and uA = mA in Multisim. It is the only bug. I tried Auto Range. It did not make any difference. Anyways the second graph I posted it right. Ic varies for -3 to 10 uA on the graph.

Maybe mA is right. I will calculate theoritically looking at the datasheet. I think Ic will be in mA when Ib is in uA.

Yes. It is mA. Ic is in mA. Multisim is right.
 

Attachments

  • bjt ce oc 3.png
    bjt ce oc 3.png
    34.4 KB · Views: 108
Last edited:

Status
Not open for further replies.

Similar threads

Part and Inventory Search

Welcome to EDABoard.com

Sponsor

Back
Top