rahdirs
Advanced Member level 1
Hi all,
I've just read paper published by "Avery Li-Chun Wang", chief scientist and co-founder of Shazam. I've understood that Shazam generates for each audio sample a finger-print that is then used to search in their data-base.
I understood that you record sound from your microphone,but how do you generate a spectrogram.
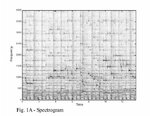
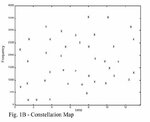
Once you get the spectrogram,you can maybe use a filter to filter out points with less intensity & you'll get the constellation with limited points & then you hash them & use search algorithm & so on.But how do you get that spectrogram(attached in fig.1) from your microphone.
Spectrogram is attached in fig.1 & how do you filter out points with less intensity to get a plot of fig.2
And as Shazam is just an app,i think all this should be done on software,so no question of spectrum analyzer etc....
I've just read paper published by "Avery Li-Chun Wang", chief scientist and co-founder of Shazam. I've understood that Shazam generates for each audio sample a finger-print that is then used to search in their data-base.
I understood that you record sound from your microphone,but how do you generate a spectrogram.
Once you get the spectrogram,you can maybe use a filter to filter out points with less intensity & you'll get the constellation with limited points & then you hash them & use search algorithm & so on.But how do you get that spectrogram(attached in fig.1) from your microphone.
Spectrogram is attached in fig.1 & how do you filter out points with less intensity to get a plot of fig.2
And as Shazam is just an app,i think all this should be done on software,so no question of spectrum analyzer etc....
Attachments
Last edited: