Continue to Site

Welcome to EDAboard.com

Welcome to our site! EDAboard.com is an international Electronics Discussion Forum focused on EDA software, circuits, schematics, books, theory, papers, asic, pld, 8051, DSP, Network, RF, Analog Design, PCB, Service Manuals... and a whole lot more! To participate you need to register. Registration is free. Click here to register now.

Fourier discrete transform of signal in dB scale

Status
Not open for further replies.

tarcisioGR

Newbie level 4
Joined
Aug 2, 2012
Messages
5
Helped
1
Reputation
2
Reaction score
1
Trophy points
1,283
Activity points
1,323
Hello there.

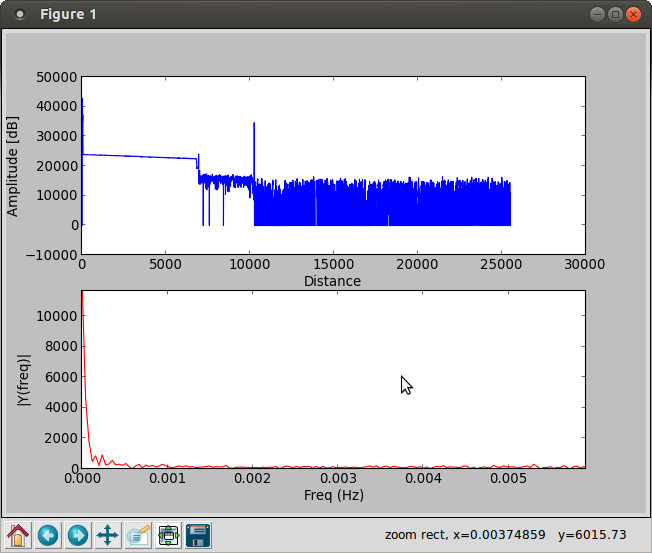
I want to analyse the spectrum of signal which is in log scale. I guess it should be linearized, that is, diveded by 20 and then raise 10 to the power of it, before input it in an FFT implementation. Is that correct? Maybe the answer could be "depends", but I really want to know what you people use to do when analysing dB scaled signals...

Ok, if the answer is yes, there's the problem of overflow when raising 10 to the power of a signal whose amplitude is, say, about 15000. Thus I want to know if there's some property about Fourier transform helping on this. For instance: "the transform of the log is the log of the transform", or something else... (I know this property does not hold, but maybe something similar could help).

It's really a newbie question, but I'm just a beginner, sorry for that.

Tarcísio
 

What type of analysis do you have in mind?

If you only have amplitude information of a frequency domain representation, you can't convert back to the time domain as you miss phase information.

Very likely the log display uses "displayed value" = 20*log(Vlin/ref). Where Vref is a certain reference (for example 1V when displayed value is in dBv). It may also use dBm (dbm = 10*log(P/1mW), so 20 dBm = 100 mW = 0.1W).

As you may have -80 dBV and for example 0 dBV in one display, the linear range can be very large (here factor 10k).
 

If you show me example of your "signal in log scale", I can probably tell you how to apply a fourier transform. Seriously speaking, I can't imagine it at all.
 

Well, the signal is in the time domain and I want to see how it is in the frequency domain, in order to know if it would be interesting to apply some kind of filter. The point is that in the time domain it's in dBm. I already calculate the FFT of it in the way it is returned by the equipment (that is, in dBm), but the result is weird, with a maximum in 0 Hz and very small components scattered by the other frequencies. In fact the signal is in dBm vs meters, but I guess this is not an important issue. Here's a snapshot of a flowed FFT attempt:
 

Attachments

  • Screenshot from 2012-08-02 14:49:56.png
    Screenshot from 2012-08-02 14:49:56.png
    45.9 KB · Views: 81

You need to reconstruct a bipolar signal to get correct fundamental frequency display. The non-linear waveform distortion vy log operation creates harmonics that aren't in the original signal. Antilog transformation (if possible according to the magnitude resolution) could improve the spectral display.
 

> Antilog transformation (if possible according to the magnitude resolution) could improve the spectral display.

I'm following this path, first Antilog and then FFT. I'm working on Python, and it indeed has a bigfloat, but the implementation of FFT I'm using (from scipy) can't work with arrays of bigfloats.

Anyway, thank you very much for your reply.
 

It should be sufficient to apply a scale factor that gives a good representation of the main signal components. I presume that you have the original, none-rectified signal available and can evaluate the effect of the different operations. But it should be obvious that the absolute value operation is seriously destroying the spectral information. So if you apply a nonlinear compression, it should at least keep the sign.
 
  • Like
Reactions: tarcisioGR

    V

    Points: 2
    Helpful Answer Positive Rating

    tarcisioGR

    Points: 2
    Helpful Answer Positive Rating
Now I see I didn't read your question correctly.

From dBm (time domain), you can't go to the frequency domain. Even after undoing the dBm operation, you don't have the polarity, so you may need to guess this by hand (time consuming). Also zero crossings lead to -infinity log values, so there must be some operation in between. If you know the signal is unipolar and non-zero, FFT will give meaningful results.

What is actually between the signal and the log display, as time domain AC signals are mostly not represented on a log scale?

When it is done, there is mostly an rms or rectifying action in between with some averaging before conversion to dBm.
 
The signal is indeed unipolar (by this you mean that it has only one direction, and does not go back and forth, right?) and non-zero (since there's always noise in the measurement). I don't know what's in the middle that converts it to log, I'm checking the manual if there's a way to get it plain from the measurement.
 

Status
Not open for further replies.

Part and Inventory Search

Welcome to EDABoard.com

Sponsor

Back
Top