ravitejaelx
Newbie level 2
Hello All,
Please solve my problem,
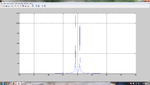
I want to find fft plot for a 50 Hz and 5V sinusoidal signal. So I tried the following code..
fm=50;
fs=150;
N=512;
t=0:1/fs:100;
y=sin(2*pi*(fs/fm)*t);
F=fftshift(abs(fft(y,N)));
k=(-N/2:N/2-1)*(fs/N);
plot(k,F);
grid on;
But I tried something but, I never achieved peak at 10Hz..
Please tell me how to convert exactly from fft bin scale to frequency scale?
And tell me how to scale magnitude to 5.
Please use the above program for your explanation..
And and tell me where I am doing mistake?
Thank you!
Please solve my problem,
I want to find fft plot for a 50 Hz and 5V sinusoidal signal. So I tried the following code..
fm=50;
fs=150;
N=512;
t=0:1/fs:100;
y=sin(2*pi*(fs/fm)*t);
F=fftshift(abs(fft(y,N)));
k=(-N/2:N/2-1)*(fs/N);
plot(k,F);
grid on;
But I tried something but, I never achieved peak at 10Hz..
Please tell me how to convert exactly from fft bin scale to frequency scale?
And tell me how to scale magnitude to 5.
Please use the above program for your explanation..
And and tell me where I am doing mistake?
Thank you!