Continue to Site

Welcome to EDAboard.com

Welcome to our site! EDAboard.com is an international Electronics Discussion Forum focused on EDA software, circuits, schematics, books, theory, papers, asic, pld, 8051, DSP, Network, RF, Analog Design, PCB, Service Manuals... and a whole lot more! To participate you need to register. Registration is free. Click here to register now.

Help me understand computing the Fourier transform using Matlab code

Status
Not open for further replies.

Aya2002

Advanced Member level 4
Joined
Dec 12, 2006
Messages
1,140
Helped
184
Reputation
376
Reaction score
117
Trophy points
1,343
Location
Iraq
Activity points
8,006
Hi experts, i have a quistion here, please read the following paragragh as it is in a pdf document on the web:

The Fourier transform can be computed using the Matlab code
Fk = fft(fn)/N; % The FFT of the signal fn
fn = ifft(Fk)*N; % The Inverse FFT
ifft(fft(fn)); % This result = fn (within machine precision)

We must divide by the number of grid points N if we want to use the results of the FFT, because Matlab puts the normalization only in the inverse transform. As a result we must then multiply the IFFT by N to counter Matlab's dividing by N.

my doubt is: is the above is correct?

Thank you in advance.

Added after 3 hours:

any reply please
 

centeredfft

any help please?
 

normalizing data matlab

Hi Aya2002,
I will wrtie some code & then i will conclude.

Tested without using normalisation factor (1/N):

time_signal=[ 1 2 3 4 3 2 ] ;
FFT_time_signal = fft(time_signal);
INVERSE_FFT_time_signal = ifft(FFT_time_signal );

o/p i got:
FFT_time_signal = 15 -4 0 -1 0 -4
INVERSE_FFT_time_signal = 1 2 3 4 3 2


Tested with using normalisation factor (1/N):

time_signal=[ 1 2 3 4 3 2 ] ;
FFT_time_signal = fft(time_signal)./length(time_signal);
INVERSE_FFT_time_signal = ifft(FFT_time_signal ).*length(time_signal);

FFT_time_signal = 2.5000 -0.6667 0 -0.1667 0 -0.6667
INVERSE_FFT_time_signal = 1.0000 2.0000 3.0000 4.0000 3.0000
2.0000

conclusion:
As per formula DFT does not use normalisation.
Instead IDFT uses normalisation factor (1/N) in the formula.
hence the matlab functon "fft" also operates as per formula does n't use normalisation factor (1/N) & "ifft" also operates as per formula uses normalisation factor (1/N) .


even without scaling we can get the same o/p.
what is the adv of using a scaling factor in fft and ifft???
i think one can think and get the answer for that.

I hope we will find it soon......

happy learning.
 

    Aya2002

    Points: 2
    Helpful Answer Positive Rating
normalize data matlab

My Friend,

see my experement below:

x=ones(1,5)

x =

1 1 1 1 1

>> s=fft(x)

s =

5 0 0 0 0

>> ifft(s)

ans =

1 1 1 1 1

as shown above, Matlab did a complete conversion and inverse conversion with out need to do any normalization, I mean , that i do not need any normalization, while the Pdf file said that we must use the normalization. From which i conclude that this document is not correct.

Now, for your quiation "what is the adv of using a scaling factor in fft and ifft???", please see my answere below;

when we represent a signal within matlab, we usually use two vectors, one for the x-data and one for the y-data. The FFT command only operates on the y-data (converting the y-data from time domain to the frequency domain). So it is up to the user to determine what the x-data in the frequency domain will be!

Now let us to take an example:

y(t)=2cos( 2 Π fo t )
-------------------------

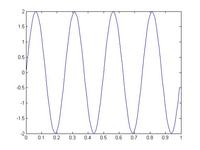
fo=4;
Fs=100;
Ts=1/Fs;
t=0:Ts:1-Ts;
n=length(t) ;
y=2*sin(2*pi*fo*t) ;
plot(t,y) ;


when we take the fft of this curve, we would ideally expect to get the following spectrum in the frequency domain , we expect to see one peak of amplitude 1 at -4 Hz, and another peak of amplitude 1 at +4 Hz. So, let us use matlab's built in function fft to see the results.

yfr=fft(y) ;
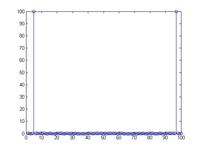
stem(abs(yfr ) ) ;


from the figure above, it does not quite look like what we predicted above. If we notice there are acouple of things that are missing:
1. The x-axis gives us no information on the frequency. How can we tell that the peaks are in the right place?

2. The amplitude is all the way up to 100.

3. The spectrum is not centered around zero.

To solve these problems, we must normalize the data and use the matlab function FFTshift after the function FFT as follows;

function [X freq]=centeredFFT(x,Fs)

N=length(x) ;
if mod(N,2) ==0
k=-N/2:N/2-1;
else
k=-(N/2)/2: (N-1)/2;
end
T=N/Fs;
freq=k/T; % The Frequency axis.
X=fft(x)/N; % Normalize the data.
X=fftshift(X); % shift the fft data so that it is centered.


the o/p of the above function will be correct frequency range and the transformed signal.

let's use this function in example:

[yfDom,frange]=centeredFFt(y,Fs);
stem(frange,abs(yfDom ) ) ;


as we can see from the plot above, the information within the frequency spectrum is entirely symmetric.

Hope this is clear.

Montadar
 

division by n affter fft in matlab

please see this site.

normally when we do fft(x) we get huge ampitude . we do scaling by dividing by N and while calculating inverse fft we also do scaling . if we do so, we cant satisfy parsevals theorem which maintains unitary between FFT & IFFT.
Also, the reason for why we scale fft basically????

all this answer were being discussed in the below mentioned site

pl see dicussion (between Matt and ramya )
**broken link removed**

also mainly this site:
**broken link removed**

See finally we got the answer.


Happy learning
 

    Aya2002

    Points: 2
    Helpful Answer Positive Rating
frequency axis matlab fourier transform

many thanks friend and i hope to see you again in a good health after the surgery

good luck and g o d save you
 

Status
Not open for further replies.

Part and Inventory Search

Welcome to EDABoard.com

Sponsor

Back
Top