sandmap
Newbie level 3
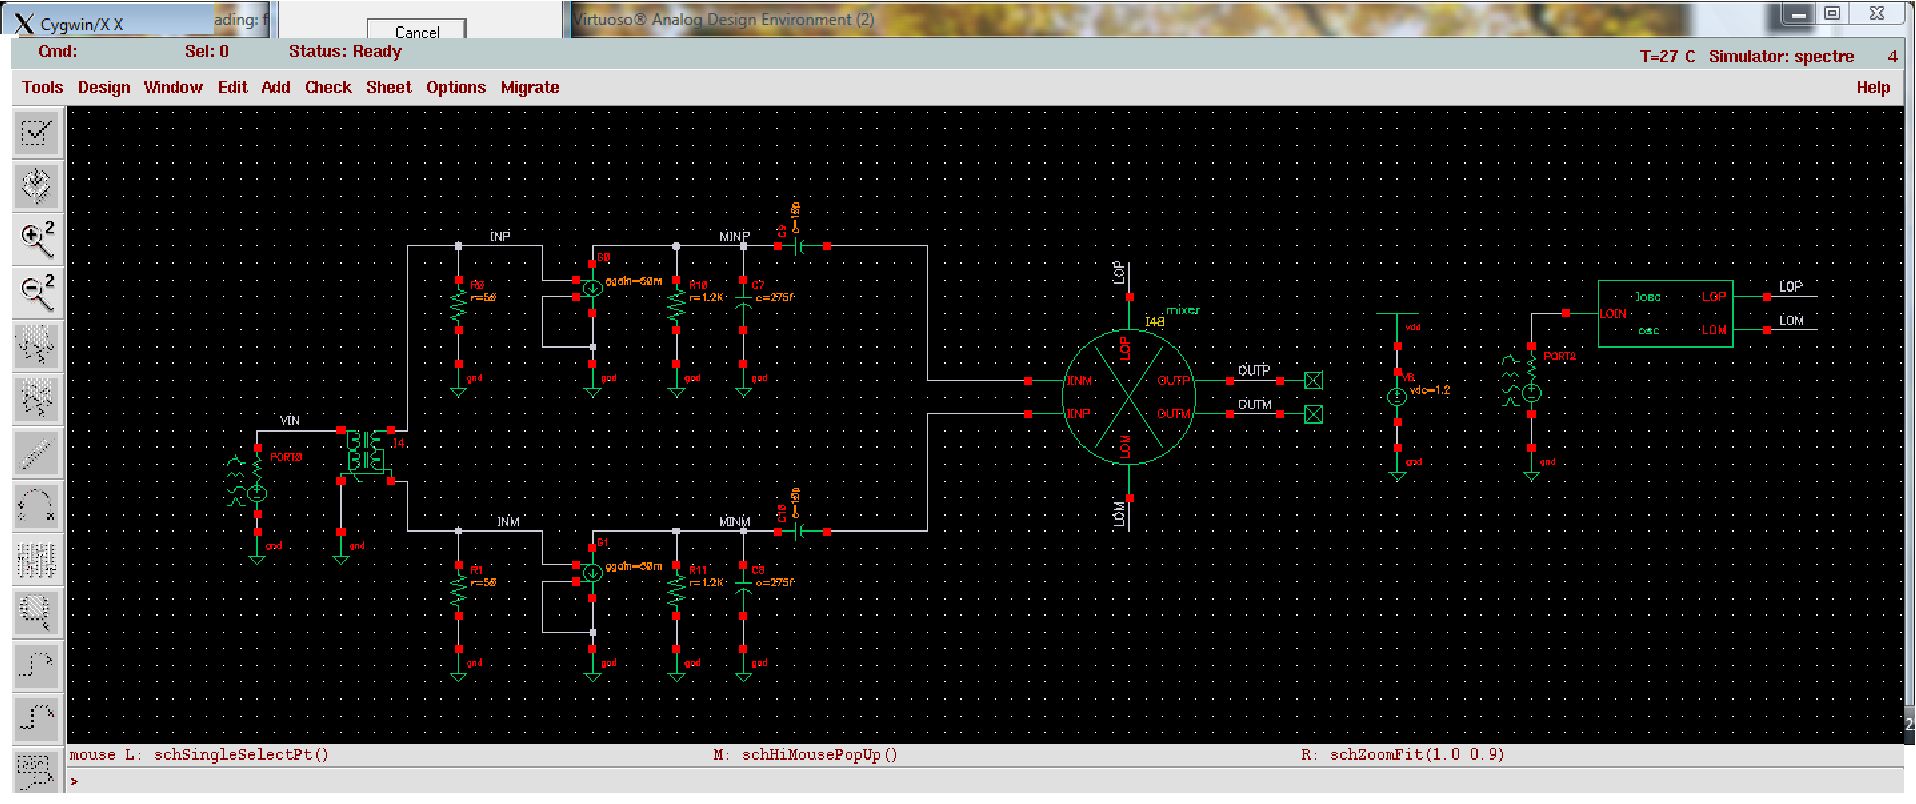
I am simulating the noise figure of a mixer. The test schematic is as shown in the first figure. The circuit in front of the mixer, models the LNA. I am checking the noise of the mixer as referred to LNA input. Since this is for direct conversion architecture I am looking at NFdsb. I am checking noise using pnoise analysis of spectreRF. In pnoise output is taken as differential voltage between the nodes OUTP And OUTM. The input source is defined as a port and is port0.
The NF plot is shown in the second figure. From the plot the noise figure at 1Mhz is 1.565
The noise contributors at 1MHz are as in the file noise_summary_1M. Now noise figure is 10log(total input referred noise/source noise). From the noise summary the source noise as a percentage of total noise is 0.7669
So the calculated noise figure is 10log(1/0.7669) = 1.153
Can someone point out to me why I am getting this difference between the plot and calculation?