Continue to Site

Welcome to EDAboard.com

Welcome to our site! EDAboard.com is an international Electronics Discussion Forum focused on EDA software, circuits, schematics, books, theory, papers, asic, pld, 8051, DSP, Network, RF, Analog Design, PCB, Service Manuals... and a whole lot more! To participate you need to register. Registration is free. Click here to register now.

[SOLVED] testing a iir filter in matlab

Status
Not open for further replies.

lakshmikalyani

Member level 1
Joined
Jan 5, 2014
Messages
36
Helped
0
Reputation
0
Reaction score
0
Trophy points
6
Location
kakinada
Activity points
248
hi
i am doing a project on filter design
i am stuck while testing the filter.
i want to know how to test a filer in matlab coding
my code is


Code dot - [expand]
1
2
3
4
5
6
7
8
9
10
11
12
13
14
15
clc;
clear all;
 
in=[100,200,300,470,500 550];
 
wp=420;
ws=490;
rp=3;
rs=80;
fs=1000;
w1=2*wp/fs;w2=2*ws/fs;
[n,wn]=cheb1ord(w1,w2,rp,rs)
[b,a]= cheby1(n,rp,wn)
[x,y]=freqz(b,a,fs);
plot(y,abs(x));


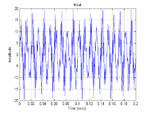
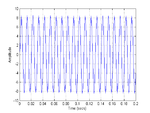
i want to give "in" as input to the filer that had designed. and check the output and analyze it
can u please help me
i know we can give a sine signal in simulink and realize the filter and fda tools but i am not getting the expected outputs
i want to do it in coding
can u help me out of it
 
Last edited by a moderator:

You have generated your transfer function coefficients, a and b. Therefore, you can use Matlab's filter function to apply the filter:


Code Matlab M - [expand]
1
out = filter(b, a, in);

 
thanku weetabixharry

i did the same thing
infact my code is now

freq=0:10:10000;
t=0.001;
in=10*sin(freq*t);
subplot(2,2,1);
plot(freq,in);

wp=400;
ws=450;
rp=2;
rs=80;
fs=1000;
w1=2*wp/fs;w2=2*ws/fs;
[N,wn]=ellipord(w1,w2,rp,rs)
[b,a]=ellip(N,rp,rs,wn);
[x,y]=freqz(b,a,fs);
mag=20*log(abs(x));
subplot(2,2,2);
plot(y,mag);

out=filter(b,a,in);
subplot(2,2,3);
plot(freq,out);

but the problem is now i am unable to analyze the output
i want to know whether i gave the correct input and the o/p is correct or not
can u help me in analyzing the output
 

First of all, whenever you post code on the forum, please use code tags so I can read it easily (this is rule number 1 in the forum rules). Also, please format and comment your code so it is easier to read.

Secondly, it looks like you have some confusion between frequency and time in your code. I have tried to tidy up your code and correct some errors, so now we have this:


Code Matlab M - [expand]
1
2
3
4
5
6
7
8
9
10
11
12
13
14
15
16
17
18
19
20
21
22
23
24
25
26
27
28
29
30
31
32
33
34
35
36
37
38
39
40
41
42
43
44
close all; clear all; clc;
 
% Generate input signal
fsamp = 1000; % (Hz)
dt = 1/fsamp; % (secs)
t = 0:dt:1;
fsine = 100;
in = 10*sin(fsine*t);
 
% Plot input signal
plot(t, in);
title('Input');
xlabel('Time (secs)');
ylabel('Amplitude');
grid on;
 
% Design filter
wp = 400;
ws = 450;
rp = 2;
rs = 80;
fs = 1000;
w1 = 2*wp/fs;w2=2*ws/fs;
[N,wn] = ellipord(w1,w2,rp,rs);
[b,a] = ellip(N,rp,rs,wn);
 
% Plot filter frequency response
[H,W] = freqz(b,a,fs);
mag = 20*log(abs(H));
figure();
plot(fsamp*W/(2*pi), mag);
title('Frequency Response');
xlabel('Frequency (Hz)');
ylabel('(dB)');
axis tight;
grid on;
 
% Apply filter and plot output
out = filter(b, a, in);
figure();
plot(t, out);
xlabel('Time (secs)');
ylabel('Amplitude');
grid on;


Okay, so now back to your question:

but the problem is now i am unable to analyze the output
i want to know whether i gave the correct input and the o/p is correct or not
can u help me in analyzing the output

What do you mean by "correct" input and output? In my opinion, the output will always be correct - it will be the filtered version of the input. Exactly what sort of analysis do you want to do?
 

i just want to analyze the output by giving some input for example sine wave by coding in matlab
 

i just want to analyze the output by giving some input for example sine wave by coding in matlab

Okay, well, you have designed your filter as a lowpass filter which should allow signals below 400Hz to pass, but remove all signals above 450Hz. Therefore, a simple experiment is to input the sum of two sine waves: one below 400Hz and one above 450Hz. The filter should then remove the higher frequency sine wave and allow only the lower frequency sine wave to pass. Therefore, the output should look like a nice clean sine wave.

Here is the code for this example:


Code Matlab M - [expand]
1
2
3
4
5
6
7
8
9
10
11
12
13
14
15
16
17
18
19
20
21
22
23
24
25
26
27
28
29
30
31
32
33
34
35
36
37
38
39
40
41
42
43
44
45
close all; clear all; clc;
 
% Generate input signal
fsamp = 1000; % (Hz)
dt = 1/fsamp; % (secs)
t = 0:dt:0.2;
fsine1 = 100; % (in passband: should remain in filter output)
fsine2 = 450; % (in stopband: should be removed by filter)
in = 10*sin(2*pi*fsine1*t) + 10*sin(2*pi*fsine2*t);
 
% Plot input signal
plot(t, in);
title('Input');
xlabel('Time (secs)');
ylabel('Amplitude');
grid on;
 
% Design filter
wp = 400; % Passband corner frequency
ws = 450; % Stopband corner frequency
rp = 2;   % Passband ripple (dB)
rs = 80;  % Stopband attenuation (dB)
w1 = 2*wp/fsamp;
w2 = 2*ws/fsamp;
[N,wn] = ellipord(w1,w2,rp,rs);
[b,a] = ellip(N,rp,rs,wn);
 
% Plot filter frequency response
[H,W] = freqz(b,a,fsamp);
mag = 20*log(abs(H));
figure();
plot(fsamp*W/(2*pi), mag);
title('Frequency Response');
xlabel('Frequency (Hz)');
ylabel('(dB)');
axis tight;
grid on;
 
% Apply filter and plot output
out = filter(b, a, in);
figure();
plot(t, out);
xlabel('Time (secs)');
ylabel('Amplitude');
grid on;


So here is the plot of the input:

attachment.php

And here is the plot of the output:

attachment.php

Clearly the filter has worked, because only the 100Hz sine wave remains. However, it is worth noting that the 100Hz sine is slightly attenuated (its amplitude is about 8.4, compared to 10 at the input). This is correct, because we can see in the frequency response graph that the amplitude response at 100Hz is a little below 0dB.
 

Attachments

  • filter_input.png
    filter_input.png
    8.1 KB · Views: 214
  • filter_output.png
    filter_output.png
    7.3 KB · Views: 221
thank you weetabixharry
i have one more doubt. during my observation of fitler frequency response the passband ripple is showing 2.3 db for rp=1db and
4.6db for rp=2.
i want to know how passband ripples are calculated
 

Status
Not open for further replies.

Part and Inventory Search

Welcome to EDABoard.com

Sponsor

Back
Top