Continue to Site

Welcome to EDAboard.com

Welcome to our site! EDAboard.com is an international Electronics Discussion Forum focused on EDA software, circuits, schematics, books, theory, papers, asic, pld, 8051, DSP, Network, RF, Analog Design, PCB, Service Manuals... and a whole lot more! To participate you need to register. Registration is free. Click here to register now.

smith chart plot covered with little curls - what does it mean?

Status
Not open for further replies.

AndreyG

Full Member level 4
Joined
May 10, 2010
Messages
196
Helped
27
Reputation
54
Reaction score
27
Trophy points
1,308
Location
Vancouver, Canada
Activity points
2,946
smith chart plot covered with little curls - what does it mean?


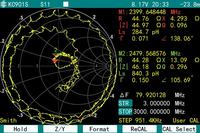
poor calibration, ok. But what exactly results in these curls?
 

Looks like is about an external interferer, perhaps from a nearby WiFi modem (I see that is a 2.4 GHz measurement).
 

No, not the external interferer. In the same lab I calibrate another network analyzer with the same cable and cal. set and there is no 'curls'.
I am trying to figure out what causes the 'curls' and hopefully remove them.
 

i have seen this curls before and after i re-calibrate, it has been ok!

i cant really figure out why its happening. its poor calibration but how poor calibration resulting the curls are good question. maybe we should ask agilent, they may know..
 
Exactly Pragash,

I see these curls when I calibrate my old HP Network Analyzer on long cable and let it sit for a while - eventually the curs appear. To get rid of them I re-calibrate, just like you. Without understanding what causes them. Now i got new NA, low cost but promising overall. Yet every time I calibrate with long cbale i got curls. When calibrate right on NA connector calibration looks decent.
 
it looks like you have multiple resonances, and one BIG resonance. Like you have a device that is matched at one frequency, but have a bias network that also has other resonances. It also might be exacerbated by a long transmission line between your device and the VNA.

Also, could be a busted VNA (with a bad port impedance)

try putting a 3 db pad between the VNA and device, and see if they mostly go away?

could be an oscillation in the device too, like stated above
 

first, The NA's source reflection error can be removed by calibration, But because of the amplitude phase response nonlinearity from the directional coupler, the calibration cannot remove the reflection err clear. so it will cause the bad curls.

but it just not look well, The uncertainty of the measurement results is within the range of the manual...for handheld instrument.

to improve this, we designed a new coupler, use digital IF process, in handheld instrumet and cover 9KHz to 6.8GHz, the coupler is hard to build.
 

We've seen this behaviour with several of the cheap VNAs.

It is the cumulative result of several stages not working properly: port-source impedance, directivity, phase detector, port isolation.

You don't see it on 'easy' calibrations with short cables and high end connectors. But if you need to measure small antennas using UFL cables and calkit, you need a higher end VNA to keep up with the shortcomings of the UFLs, especially above 2GHz.

There is a paper that documents this difference between several VNAs: https://www.gsm-modem.de/M2M/wp-content/uploads/2014/04/IoT-M2M-Cookbook-Harald_excerpt.pdf
 

Status
Not open for further replies.

Part and Inventory Search

Welcome to EDABoard.com

Sponsor

Back
Top