Continue to Site

Welcome to EDAboard.com

Welcome to our site! EDAboard.com is an international Electronics Discussion Forum focused on EDA software, circuits, schematics, books, theory, papers, asic, pld, 8051, DSP, Network, RF, Analog Design, PCB, Service Manuals... and a whole lot more! To participate you need to register. Registration is free. Click here to register now.

Shape of Resonant Frequency Plot

Status
Not open for further replies.

micro7311

Junior Member level 2
Joined
Jun 21, 2015
Messages
22
Helped
0
Reputation
0
Reaction score
0
Trophy points
1
Activity points
199
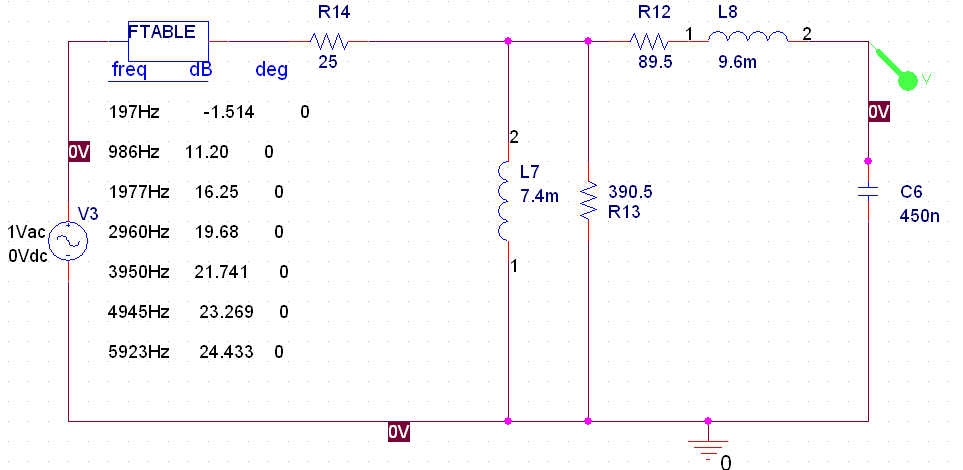
Hi, I have the attached circuit and I am looking for information on what external components can be added to make the plot "fall" faster after the resonant frequency. Keeping all values the same, what other passives (RLC) can be added to make the response drop more rapidly and have a higher Q factor? Resonant.png
 

Thank you. Either viewing in log or linear I still would like to have it drop faster after resonance.
 

I want an asymmetrical Q. Almost like the inverse of the shape posted. I understand how to shift resonant frequency but not affect the symmetry of the plot.
 

The problem with the design is the inductors cancel and you only have a 1st order RC rolloff with poor Q.

A proper filter design requires specs for pass band gain, band stop attenuation as well as source and output impedance with load.
 
I want an asymmetrical Q. Almost like the inverse of the shape posted. I understand how to shift resonant frequency but not affect the symmetry of the plot.

From this, it is not clear to me what you really want to realize. Can you desribe it with words?
For example: Bandpass with center frequency at... and a 3dB-bandwidth of... (or Q=...).
 
Since you're driving this with a current source, L2 and R2 do nothing. If you want a faster rolloff, you need another L-C stage.
 
Thank you, actually I have since gathered more data and simulations. I am trying to match experimental data with simulated data and am observing characteristics I cannot explain. The schematic is a model of a sensor which is a coil of wire receiving magnetic flux and generating output voltage. The model can be similar to a transformer model. The only external component I am using is the load capacitor at the output. In the first plot with the first load cap, the shape of the simulated data does not quite match the experimental, but the resonant frequency matches as it should (based on L and C). In the second plot with the larger load cap, the resonant frequency sim does NOT match experimental. This leads me to believe that there is a parasitic in the circuit which is varying with load capacitance causing resonant frequency shift.

I am obtaining output voltage across the load cap with a true RMS meter with input impedance of <100pf and >10M Ohm, so I don't think this can be causing measurement errors.

I have the following questions which may be interrelated:


1. How to model the amplitude vs frequency plot to match experimental; the rise and fall are not symmetric, the fall is much faster.

2. Why with varying load capacitor does the resonant frequency change from ideal? What variable in the model is causing this?


After specs, and you determine the order of filtering outside the BPF, then you know the minimum number of reactive elements as f increases past resonance. The series & shunt L's negate each other past resonance.

Examine your source and model it more accurately, then verify it with a fixed R load.

Next time choose log for both axes and plot gain or at least measure input and normalize to 1v rms or 0dB

I doubt you have either a current source or a 0.1 Ohm voltage source. What is it?
 
Thank you, can you expand a bit further? I am modeling per Fig. 11.7:

**broken link removed**
 

Fig 11.7 is that of the voice coil actuator in a disk drive, which has a copper sleeve around the pole. The purpose of this is to lower inductance and make the voice coil motor run faster and more linear. The force is current. The magnetizing inductance Ln as shown in schematic appears to be a "typo" and should be Lm

shunt coil.jpg

Adding a capacitor to this equivalent circuit makes no sense.

The source impedance is not given but will be low.

So what are you trying to do? Understand the frequency response of a HDD voice coil motor

or make a filter?
 
I have a magnetic sensor (coil, pole piece, magnet) which I am modeling with RLC. I believe the model can be similar to that figure. I have experimental data from the sensor (by passing gear by at a certain frequency) that I am trying to fit. RLC was estimated based on impedance measurements.

The source is the voltage generated across the coil, and I believe can be modeled as a voltage source as shown (table parameters were obtained experimentally with no capacitor load). Assuming a source impedance of 20 Ohm, plot attached with log scale.


The moving coil mass can be modeled by a capacitor but at lower frequencies or bigger mass the inertia does generates a back EMF the error increases in this model.

Normally the VCM driver is a very low RdsOn full bridge with negative feedback, so 0.1 is quite possible now.
If you are using a 50 Ohm generator scaled down to 20 Ohms , ok.
 

The sensor is not a VCM so there is no moving coil. The sensor is a solenoid. I am approximating the voltage generated by the solenoid (change in flux / change in time) as the source on the left side of the circuit. Could this back emf be causing resonant frequency change from sim to experimental? If so how can this be modeled?
 

The sensor is not a VCM so there is no moving coil. The sensor is a solenoid. I am approximating the voltage generated by the solenoid (change in flux / change in time) as the source on the left side of the circuit. Could this back emf be causing resonant frequency change from sim to experimental? If so how can this be modeled?


There are many pages in your study guide relating to solenoids in section 11.2
I am unable to follow what you are doing or asking for with little info provided. Sorry.

Inductance will vary with core position in the coil and back EMF varies with velocity. Interwinding capacitance should be fairly constant.
 

This illustrates how you can split up the capacitor in a series LC, to adjust the steepness of curves to either side of the center frequency.


By adjusting values it should be possible to obtain your desired rolloff curves.
 

Status
Not open for further replies.

Part and Inventory Search

Welcome to EDABoard.com

Sponsor

Back
Top