farhan13
Newbie level 5
hi..
i have a problem regarding qpsk project..
input for i & q are:
i=0.5sin(2pi10t)+sin(2pi20t)
q=0.7sin(2pi15t)+0.3sin(2pi25t)
sampling freq=500
carrier freq=21000
how do i simulate this using matlab?do u have any code example?
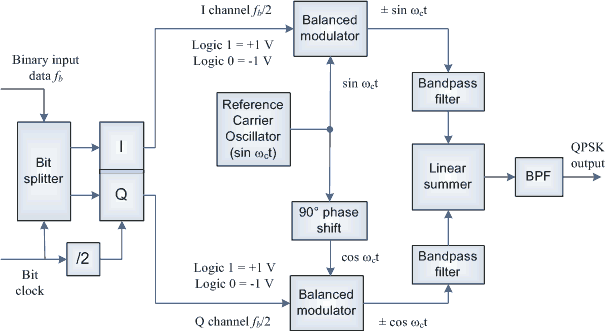
below are the diagram for my project
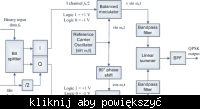
i have a problem regarding qpsk project..
input for i & q are:
i=0.5sin(2pi10t)+sin(2pi20t)
q=0.7sin(2pi15t)+0.3sin(2pi25t)
sampling freq=500
carrier freq=21000
how do i simulate this using matlab?do u have any code example?
below are the diagram for my project
")