Continue to Site
Follow along with the video below to see how to install our site as a web app on your home screen.
Note: This feature may not be available in some browsers.
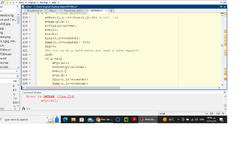
You need to identify the peaks all along then identify if a peak occurs prematurely and is of higher amplitude.I have code Matlab, but the P wave and T wave when PVC Arrhythmia is detected are wrong can you help me?
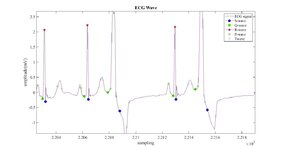
View attachment 180817
%P Peak
a=Rloc(i,j)-90:Rloc(i,j)-10;
m=max(y1(a));
b=find(y1(a)==m);
b=b(1);
b=a(b);
Ploc(i,j)= round(b);
Pamp(i,j)=round(m);
%T Peak
a=Rloc(i,j)+25:Rloc(i,j)+90;
m=max(y1(a));
b=find(y1(a)==m);
b=b(1);
b=a(b);
Tloc(i,j)=round(b);
Tamp(i,j)=round(m);do you have a text or binary file for that ECG waveform to be read in matlab?I am using a window that:
%P Peak
a=Rloc(i,j)-90:Rloc(i,j)-10;
m=max(y1(a));
b=find(y1(a)==m);
b=b(1);
b=a(b);
Ploc(i,j)= round(b);
Pamp(i,j)=round(m);
%T Peak
a=Rloc(i,j)+25:Rloc(i,j)+90;
m=max(y1(a));
b=find(y1(a)==m);
b=b(1);
b=a(b);
Tloc(i,j)=round(b);
Tamp(i,j)=round(m);
the window is used to search for locations based on the R wave, how can be corrected when PVC beats, by code MatLab?
and thanks for your response.
I have, but I work on the signal from MIT-BIH Arrhythmia.do you have a text or binary file for that ECG waveform to be read in matlab?
thank you for your response, I am a Master's Student working on the detection of PVC Arrhythmia by machine learning, so is very important to the Feature Extraction step like PR interval, QT interval, RR interval, QRS width, pre_rr, and post_rr interval.My Electrical Engineering Masters Thesis was on exactly this - automatic detection of both regular and ectopic ECG beats. I used a 1MHz Z80 and assembler in the late 1970's. Also I was reading the signal from a Holter Monitor at 60 times real speed (so a complete 24 hour measurement was analysed in 24 minutes).
My approach was to detect the peak of the QRS (or ectopic) wave and then correlate the whole waveform against up to 6 templates - one 'normal' and up to 5 ectopics. (I also calculated the R-R interval to get the heart rate etc.) The assumption made was that the first few beats were the 'normal' ones to fill in the first template. If a beat was detected that didn't match any template then it was 'remembered' as a new template beat.
Remember that the ectopic you are looking at comes from the ventricle and so there need not be a P wave (which is the atria contracting) and the T wave (the ventricles depolarising) will not be 'standard' either as the depolarisation will not follow the normal 'bottom to top' path through the ventricles.
I hope you have studied the physiology of the heart as this is (in my opinion) essential knowledge to interpret the ECG waveform.
Susan
Of course you would. Re-read the last 2 paragraphs of my posting above, especially the 2nd to last.but I have a problem with the p wave and T wave in case PVC.
That is a different task. If you want all such checks by machine then I am afraid it is a big job and as Susan suggested you need to have templates to correlate. If your focus is on PVC only and as per your waveforms then I expect it to be simpler and then you don't expect to care about P or T waves.so is very important to the Feature Extraction step like PR interval, QT interval, RR interval, QRS width, pre_rr, and post_rr interval.
but I have a problem with the p wave and T wave in case PVC.
the target is based on feature extraction.That is a different task. If you want all such checks by machine then I am afraid it is a big job and as Susan suggested you need to have templates to correlate. If your focus is on PVC only and as per your waveforms then I expect it to be simpler and then you don't expect to care about P or T waves.
I don't have specific experience with ECG or feature extraction tools but have done image correlation for tracking. But below are my thoughts.But how can create the templates for normal and PVC to Apply in Matlab? To make ECG Wave (P, QRS, and T ) correct in the signal.
--- Updated ---
the target is based on feature extraction.
Good evening.Of course you would. Re-read the last 2 paragraphs of my posting above, especially the 2nd to last.
Susan
(Before I start, I mis-typed in my first response above: instead of 'depolarisation' I meant 'repolarisation'.)
I may have misunderstood your problem but some basic physiology should show you why you are having trouble with identifying the P wave in ventricular ectopics.
A sinus beat starts when the SA node begins a coordinated wave of contraction through the atria. This is the P wave.
The 'beat' then passes through the AV node, the Bundle of His and then the Purkinji fibres into the bottom part of the ventricles where the cardiac muscle then have a coordinated contraction back up towards the fat layer that separate the atria and ventricles. This is the QRS wave.
Given the physiology of nerve cells and muscle cells, once they are triggered (depolarised), they enter a refractory period (where they cannot be triggered again, which stops the contraction doubling back on itself) while they are repolarised. This is the T wave.
If an ectopic beat originates in the ventricles, then (except in very unusual circumstances) there will not be a P wave (and those unusual circumstances typically mask any P wave that might be generated from the ectopic).
So looking for a P wave in an ectopic beat is really a waste of time.
Also, the T wave can often be mis-shapen (as opposed to its shape for a sinus beat).
What I did was to look for the biggest peak (positive or negative as ectopics can produce inverted QRS complexes) and then look back and forward a number of samples (I was working with 100 samples/second of the waveform) and 'assumed' that covered the whole wave. That was what I stored in memory (remember I was using assembler - we only had very basic compilers then and nothing like MatLab) as a template if I couldn't match a previously seen beat.
This was my way of 'machine learning'. It didn't matter what the actual beat waveform looked like (it didn't need to conform to a pre-defined shape) as this changes with each patient, the lead configuration and placement and other physiological conditions.
The context for my work was to provide a cardiologist with a summary of the specific ectopics that a patient had (plus the R-R interval.heart rate) in the 24 hour ambulatory monitoring period. Therefore the analysis of the ectopics was done by a trained human so I didn't need to get into minute details about 's-t' intervals etc..
While (micro)computers are 1000x (or more) faster these days, I still would question why you need in-depth real-time analysis of each beat. You can (almost) ignore the sinus beats and concentrate on the ectopics which generally repeat (i.e. they have roughly the same shape for a particular patient) even if there are several ectopic foci. Once you have the representative beats then you can analyse the heck out of them.
Susan
--- Updated ---
By the way, I just started to read the paper you referenced and saw on page 5:
Detection of premature ventricular contraction. Detection of premature ventricular contraction is a very important step for demarcating an area where P waves can occur. The detection comprises two steps, feature extraction and heartbeat classification. The results of classification are used to decide whether the P wave should be searched for. The P wave is not searched for if the actual QRS complex is classified as PVC, because the P wave is not present.
Susan