Continue to Site

Welcome to EDAboard.com

Welcome to our site! EDAboard.com is an international Electronics Discussion Forum focused on EDA software, circuits, schematics, books, theory, papers, asic, pld, 8051, DSP, Network, RF, Analog Design, PCB, Service Manuals... and a whole lot more! To participate you need to register. Registration is free. Click here to register now.

Plotting characteristics curve of Phase-frequency detector (PFD)

Status
Not open for further replies.
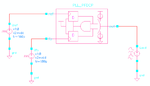
Try following netlist
Code:
.option PARHIER = LOCAL

.option POST
.temp 25

.GLOBAL gnd! vdd!

.param fund_period=2n
.param delta_phase_deg=0.0
.param tdelay='(delta_phase_deg/360)*fund_period'

v5 vdd! gnd! dc=1.8

v17 start gnd! dc=0 pulse ( 0 1.8 500p 1p 0 0.5 1)

v16 out_clk gnd! dc=0 pulse(0 1.8 '1.1*fund_period+tdelay'
+ 5p 5p 'fund_period/2' fund_period)

v2  ref_clk gnd! dc=0 pulse(0 1.8 '1.1*fund_period'
+ 5p 5p 'fund_period/2' fund_period)

xi12 vdd! down up out_clk ref_clk start pfdv2_sch
xi17 down up vctrl+ vctrl- cpv2_sch

vdummy_n vctrl- vctrl_n dc=0
c18 vctrl_n gnd! c=.8p
h_n out_n gnd! ccvs vdummy_n 1

vdummy_p vctrl+ vctrl_p dc=0
c7 vctrl_p gnd! c=.8p
h_p out_p gnd! ccvs vdummy_p 1

*.tran .1n 75n start=0

.sn tres='fund_period/10' period=fund_period
+ trinit='5*fund_period' maxtrinitcycles=5
+ sweep delta_phase_deg lin 101 -360 360

.op All 0
.option opfile=1 split_dp=1

.probe v(out_p) v(out_n)
.probe sn v(out_p) v(out_n)
.probe snfd v(out_p) v(out_n)
.probe snfd vdb(out_p) vdb(out_n)
.probe snfd v(out_p)[0] v(out_n)[0]
.probe snfd vr(out_p)[0] vr(out_n)[0]

.end
Plot vdb(out_p) and vdb(out_n) of "input.snf0".
Plot v(out_p):0 and v(out_n):0 of "input.snf0" with choosing real() in Custom WaveView.
Plot vr(out_p):0 and vr(out_n):0 of "input.snf0".
 

Hello! Here are the plots for the netlist edited using #41
Plot vdb(out_p) and vdb(out_n) of "input.snf0".
vdb(out_p)(out_n)_snf0.png

Plot v(out_p):0 and v(out_n):0 of "input.snf0"
v(out_p_n)snf0.png

Plot vr(out_p):0 and vr(out_n):0 of "input.snf0"
vr(out_p_n).png

- - - Updated - - -

The plot you ask in #40.
Plot i1(c7):0 and i1(c18):0.
i1c7_i1c18_snf0.png
 

Run $<installdir>/hspicerf/examples/pfdcpGain.sp
I'm sorry. I tried searching the file, and either I am not allowed to access it or it actually doesn't exist in my directories.
 

Plot vdb(out_p) and vdb(out_n) of "input.snf0".
I can confirm 11 spectrum tones from 0.0 to 5.0GHz, step=0.5GHz.
This 5.0GHz is determined from "1/tres=10/fund_period".

.param fund_period=2n
.sn tres='fund_period/10' period=fund_period
+ trinit='5*fund_period' maxtrinitcycles=5
+ sweep delta_phase_deg lin 101 -360 360

Plot v(out_p):0 and v(out_n):0 of "input.snf0"
Plot vr(out_p):0 and vr(out_n):0 of "input.snf0"
Order of Magnitude is not extraordinary.
And they are same.
However they don't show characteristics of PFD+CP at all.
And output level is too small.
Does your PFD work correctly ?

Plot i1(c7):0 and i1(c18):0
Order of Magnitude is extraordinary.
They should be same as
Plot v(out_p):0 and v(out_n):0 of "input.snf0"
However they can't be same.
I simply mapped i1(c7):0 and i1(c18) to v(out_p):0 and v(out_n):0 by CCVS.
Why ?

I would like to confirm you netlist.
Show me your true netlist.

I'm sorry. I tried searching the file, and either I am not allowed to access it or it actually doesn't exist in my directories.
Enter "which hspice" in unix command prompt.
Then you can get location "hspice" command.
You can find example directory near there.
 

Netlist:
Code:
.option PARHIER = LOCAL

.option POST
.temp 25

.GLOBAL gnd! vdd!

.param fund_period=2n
.param delta_phase_deg=0.0
.param tdelay='(delta_phase_deg/360)*fund_period'


xi12 vdd! down up out_clk ref_clk start pfdv2_sch
v17 start gnd! dc=0 pulse ( 0 1.8 500p 1p 0 0.5 1)

v16 out_clk gnd! dc=0 pulse(0 1.8 '1.1*fund_period+tdelay'
+ 5p 5p 'fund_period/2' fund_period)

v2  ref_clk gnd! dc=0 pulse(0 1.8 '1.1*fund_period'
+ 5p 5p 'fund_period/2' fund_period)

v5 vdd! gnd! dc=1.8
c18 vctrl- gnd! c=.8p
c7 vctrl+ gnd! c=.8p
xi17 down up vctrl+ vctrl- cpv2_sch

.tran .1n 75n start=0

.sn tone='1/fund_period' nharms=10
+ trinit='5*fund_period' maxtrinitcycles=5
+ sweep delta_phase_deg lin 101 -360 360

.op All 0
.option opfile=1 split_dp=1

.probe i1(c7)
.probe i1(c18)
.probe snfd i(c7)[0]
.probe snfd i(c18)[0]
*.probe snfd i(c18) i(c7)
*.probe snfd i(c18)[0] i(c7)[0]

.probe snfd ir(c18)[0]
.probe snfd ir(c7)[0]
*.probe snfd ir(c18) ir(c7)
*.probe snfd ir(c18)[0] ir(c7)[0]

.probe sn i(c18) i(c7)

.measure sn Ip AVG i(c18)
.measure sn In AVG i(c7)
.measure sn Ipump param='In+Ip'

.end
 

Does your PFD work correctly ?
I've been using the .tran analysis in checking my PFD+CP since before. And from the papers I've got, only the output from the .tran was shown that is why I wanted to try showing the plots (such as in the beginning of this thread) to check my PFD.

- - - Updated - - -

Netlist in #41:
Code:
.option PARHIER = LOCAL

.option POST
.temp 25

.GLOBAL gnd! vdd!

.param fund_period=2n
.param delta_phase_deg=0.0
.param tdelay='(delta_phase_deg/360)*fund_period'

v5 vdd! gnd! dc=1.8

v17 start gnd! dc=0 pulse ( 0 1.8 500p 1p 0 0.5 1)

v16 out_clk gnd! dc=0 pulse(0 1.8 '1.1*fund_period+tdelay'
+ 5p 5p 'fund_period/2' fund_period)

v2  ref_clk gnd! dc=0 pulse(0 1.8 '1.1*fund_period'
+ 5p 5p 'fund_period/2' fund_period)

xi12 vdd! down up out_clk ref_clk start pfdv2_sch
xi17 down up vctrl+ vctrl- cpv2_sch

vdummy_n vctrl- vctrl_n dc=0
c18 vctrl_n gnd! c=.8p
h_n out_n gnd! ccvs vdummy_n 1

vdummy_p vctrl+ vctrl_p dc=0
c7 vctrl_p gnd! c=.8p
h_p out_p gnd! ccvs vdummy_p 1

*.tran .1n 75n start=0

.sn tres='fund_period/10' period=fund_period
+ trinit='5*fund_period' maxtrinitcycles=5
+ sweep delta_phase_deg lin 101 -360 360

.op All 0
.option opfile=1 split_dp=1

.probe v(out_p) v(out_n)
.probe sn v(out_p) v(out_n)
.probe snfd v(out_p) v(out_n)
.probe snfd vdb(out_p) vdb(out_n)
.probe snfd v(out_p)[0] v(out_n)[0]
.probe snfd vr(out_p)[0] vr(out_n)[0]

.end

- - - Updated - - -

Run $<installdir>/hspicerf/examples/pfdcpGain.sp

Then plot i1(closed):0
I already run it but can't find i1(closed):0

- - - Updated - - -

Order of Magnitude is extraordinary.
They should be same as
Plot v(out_p):0 and v(out_n):0 of "input.snf0"
However they can't be same.

I'm confused.
 

I already run it but can't find i1(closed):0
Can you get $<installdir>/hspicerf/examples/pfdcpGain.sp ?

If so, i1(closed):0 is mistake.

Is there following in "pfdcpGain.sp" ?
Code:
* SN setup
.SN tres=0.1n period=40n trinit=60ns  SWEEP phase LIN 5 -10.0 10.0 
.probe sn v(data) v(clock) v(up) v(down) i(vload)
.print snfd i(vload)[0] 
.probe snfd i(vload)[0]

Plot i1(vload):0
Then show result.
 
Last edited:

Can you get $<installdir>/hspicerf/examples/pfdcpGain.sp ?
I found the pfdcpGain.sp at the different directory.

Is there following in "pfdcpGain.sp" ?
* SN setup
.SN tres=0.1n period=40n trinit=60ns SWEEP phase LIN 5 -10.0 10.0
.probe sn v(data) v(clock) v(up) v(down) i(vload)
.print snfd i(vload)[0]
.probe snfd i(vload)[0]
Yes, the lines exist at the .sp that I run.

Plot i1(vload):0
I attached i1(vload):0 plots of the .snf0 and .sn0.
i1_vload_sn0.pngi1_vload_snf0.png
 

In your pfd-cp, shrink range of delta_phase_deg, e.g. from -20 to 20
This netlist was the version before I inserted #41. I also shrink range of delta_phase_deg as what you had stated.
Code:
.option PARHIER = LOCAL

.option POST
.temp 25

.GLOBAL gnd! vdd!

.param fund_period=2n
.param delta_phase_deg=0.0
.param tdelay='(delta_phase_deg/360)*fund_period'


xi12 vdd! down up out_clk ref_clk start pfdv2_sch
v17 start gnd! dc=0 pulse ( 0 1.8 500p 1p 0 0.5 1)

v16 out_clk gnd! dc=0 pulse(0 1.8 '1.1*fund_period+tdelay'
+ 5p 5p 'fund_period/2' fund_period)

v2  ref_clk gnd! dc=0 pulse(0 1.8 '1.1*fund_period'
+ 5p 5p 'fund_period/2' fund_period)

v5 vdd! gnd! dc=1.8
c18 vctrl- gnd! c=.8p
c7 vctrl+ gnd! c=.8p
xi17 down up vctrl+ vctrl- cpv2_sch

.tran .1n 75n start=0

.sn tone='1/fund_period' nharms=10
+ trinit='5*fund_period' maxtrinitcycles=5
+ sweep delta_phase_deg lin 101 -20 20

.op All 0
.option opfile=1 split_dp=1

.probe i1(c7)
.probe i1(c18)
.probe snfd i(c7)[0]
.probe snfd i(c18)[0]
*.probe snfd i(c18) i(c7)
*.probe snfd i(c18)[0] i(c7)[0]

.probe snfd ir(c18)[0]
.probe snfd ir(c7)[0]
*.probe snfd ir(c18) ir(c7)
*.probe snfd ir(c18)[0] ir(c7)[0]

.probe sn i(c18) i(c7)

.measure sn Ip AVG i(c18)
.measure sn In AVG i(c7)
.measure sn Ipump param='In+Ip'

.end

- - - Updated - - -

The plot of i1 in snf0.. I'm not sure if this is the equivalent of i1(vload):0
Screenshot_2.png
 

No.
Map current to voltage by CCVS.
Then plot voltage.

There is no problem in your Hspice Version.
I suspect your circuit itself.
 
Last edited:

I suspect your circuit itself.
Compare time domain waveform in #50 with yours.
I will recheck my circuit and apply what I learned in this thread. If my circuit is the problem at least now I have the idea on plotting the curve. Thank you for all the help. :smile: Salamat!
 

When I see your time domain current signals, i1(c7) and i1(c18), in #33, they are not appropriate for PFD-Charge Pump operation.

In your case, I think node voltage of "vctrl+" and "vctrl-" are too low or too high, so charge pump can not operate.

Try plot time domain waveform of node voltage of "vctrl+" and "vctrl-".
Are they reasonable ?

I don't use capacitor as load for simulation of pfd-cp.
I use dc voltage source as load which dc voltage value is typical input voltage of VCO or simply Vdd/2.

I will recheck my circuit and apply what I learned in this thread.
If my circuit is the problem at least now I have the idea on plotting the curve.
I wait for good report from you.

Good Luck.
 

Attachments

  • 151029-230458.png
    151029-230458.png
    26.1 KB · Views: 86
Last edited:

Status
Not open for further replies.

Part and Inventory Search

Welcome to EDABoard.com

Sponsor

Back
Top