sweeety
Newbie level 5
hi everyone..
need some help to plot magnitude of gm Vs Vgs
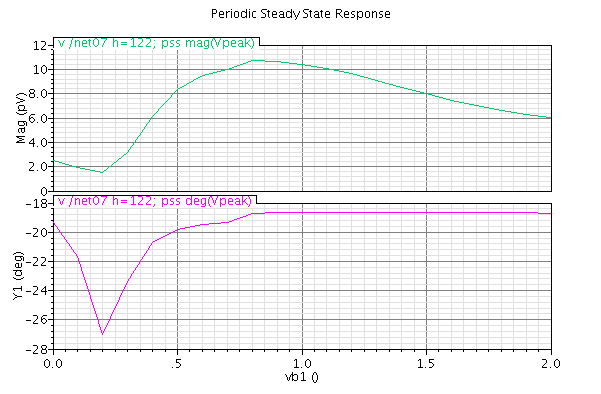
Firstly a table data was extracted from the plot(magnitude and phase) using pss analysis where Vgs is sweeped for a range.Then i imported the data in matlab. Their i was strucked..could any one please tell me how to plot gm(both +ve and -ve axis) Vs Vgs
Thank you in advance...
Attaching the plot which I got from pss analysis..
need some help to plot magnitude of gm Vs Vgs
Firstly a table data was extracted from the plot(magnitude and phase) using pss analysis where Vgs is sweeped for a range.Then i imported the data in matlab. Their i was strucked..could any one please tell me how to plot gm(both +ve and -ve axis) Vs Vgs
Thank you in advance...
Attaching the plot which I got from pss analysis..
Attachments
Last edited by a moderator: