kender
Advanced Member level 4
Colleagues,
Does anyone know how to scroll the CWGraph control? Here's the behavior I want to achieve:
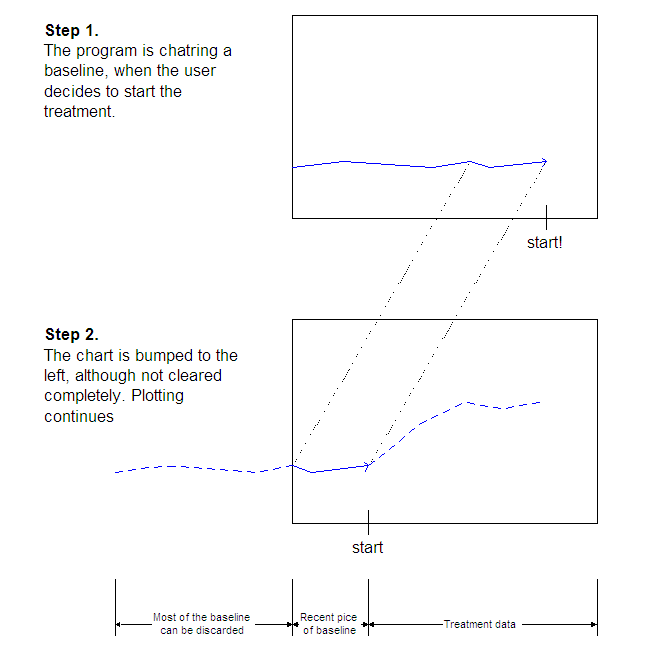
1. The graph's X axis spans from 0 to 3000. In the beginning, it's charting a baseline (using ChartY method).
2. Let's say, it charted to 2500, when the user initiates an experiment.
3. Graph immediately scrolls left leaving only the last 500 points of the baseline (this is the part I don't know how to do). The rest can be discarded.
4. Plotting of the experiment data continues from 500 onward.
Could anybody give me some suggestions?
Thanks,
- Nick
P.S. I'm using VB6 and Measurement Studio 8.1.11.
Here's the desired behavior in a storyboard form:
Does anyone know how to scroll the CWGraph control? Here's the behavior I want to achieve:
1. The graph's X axis spans from 0 to 3000. In the beginning, it's charting a baseline (using ChartY method).
2. Let's say, it charted to 2500, when the user initiates an experiment.
3. Graph immediately scrolls left leaving only the last 500 points of the baseline (this is the part I don't know how to do). The rest can be discarded.
4. Plotting of the experiment data continues from 500 onward.
Could anybody give me some suggestions?
Thanks,
- Nick
P.S. I'm using VB6 and Measurement Studio 8.1.11.
Here's the desired behavior in a storyboard form: