Lonari
Newbie level 6
Hi,
I have a sound file, with noise, and I'm trying to remove the noise.
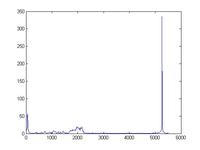
The way I've been trying to do this, is to do an FFT, and plot to find frequency, and do a low pass filter to remove the higher frequency. Here are the steps I've been using:
It does not seem to work. I guess I can upload the sound file if needed.
I have a sound file, with noise, and I'm trying to remove the noise.
The way I've been trying to do this, is to do an FFT, and plot to find frequency, and do a low pass filter to remove the higher frequency. Here are the steps I've been using:
Code:
%Frequency f
f=fs/2*linspace(0,1,1024/2+1);
%Discrete Fourier Transform y
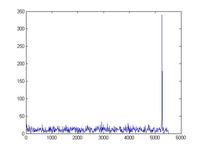
y=fft(data);
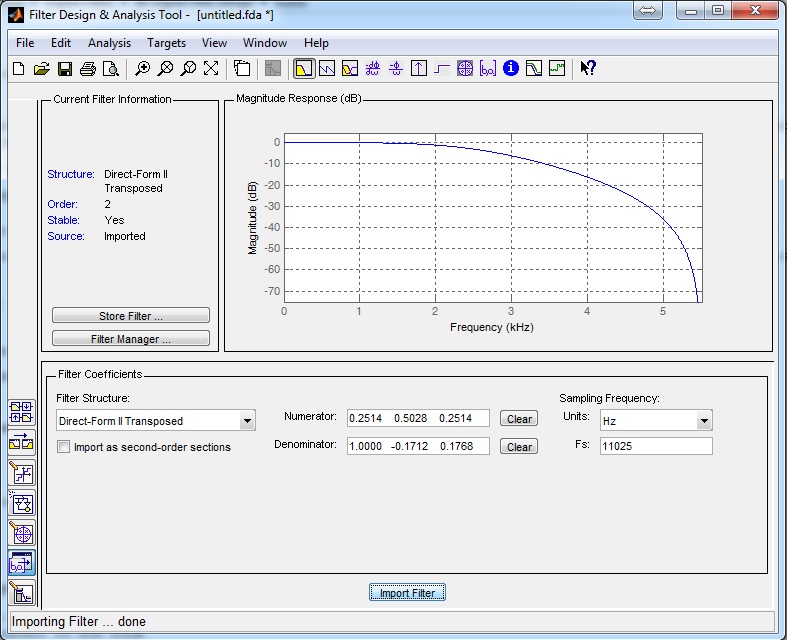
%Butterworth Filter with order 2, cuttoff Frequency 4500, sample frequency 11025
[B,A]=butter(2,5000/11025);
plot(f,2*abs(y(1:1024/2+1)))
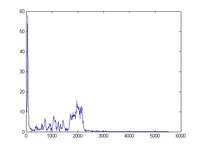
filtdata=filtfilt(B,A,data);
z=fft(filtdata);
plot(f,2*abs(filtdata(1:1024/2+1)));
sound (filtdata)It does not seem to work. I guess I can upload the sound file if needed.
") , so you can generously trade passband flatness for a steeper filter skirt.
, so you can generously trade passband flatness for a steeper filter skirt.