shaikss
Full Member level 4
Hi,
I never did S- parameter analysis and it is required to plot Q vs F for a given circuit.
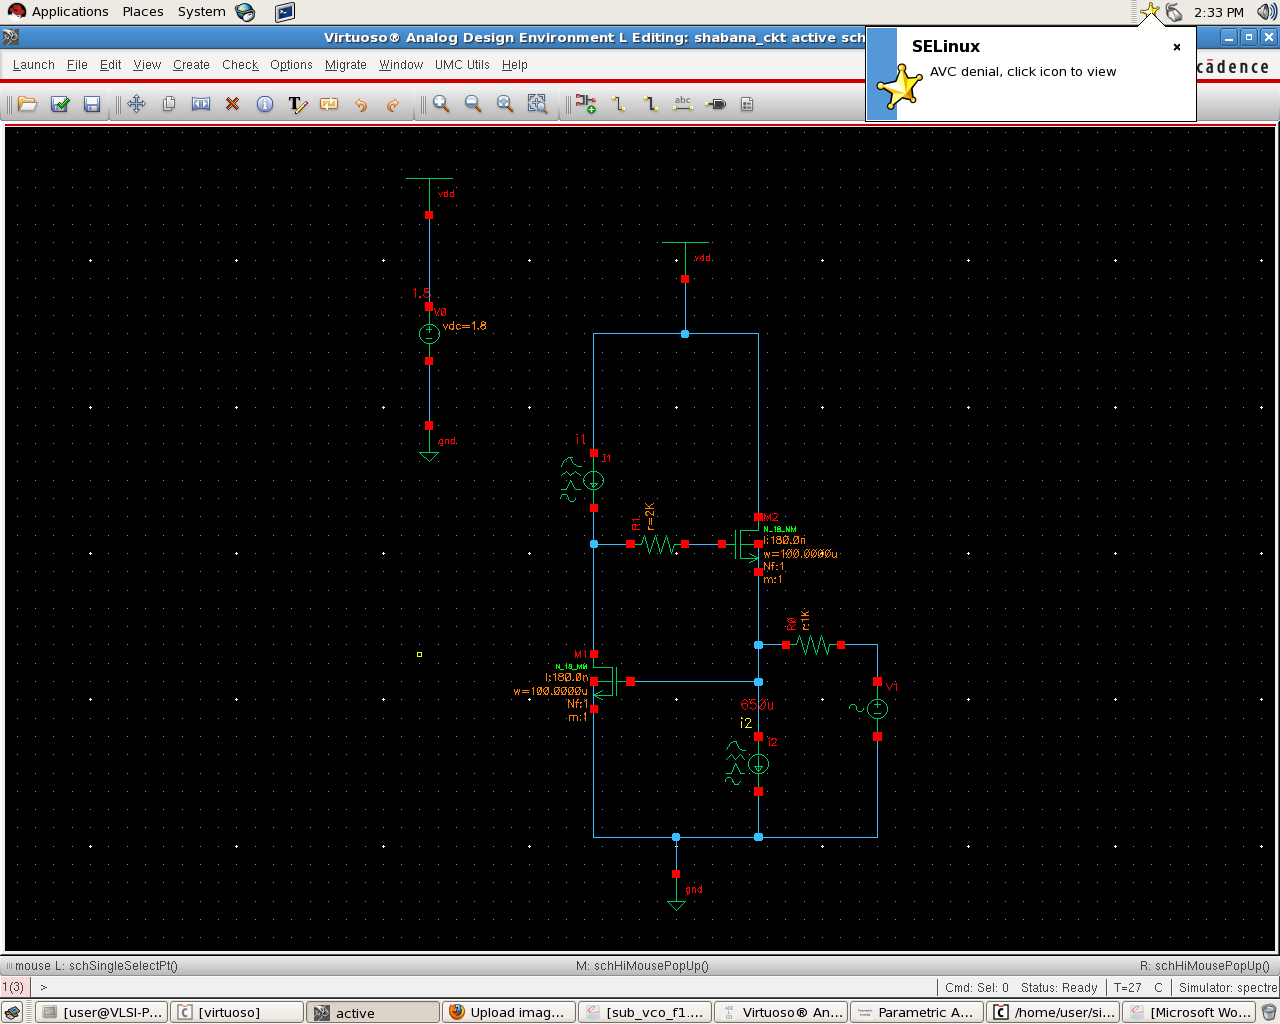
Attached is the circuit.
Please let me know how to do the same.
None of my seniors or ppl who has done it earlier are here. So, I am dependent on edaboard.
Goggled and browsed edaboard, to do the same, but couldn't succeed.
In desperate need, pls help.
Thanks
I never did S- parameter analysis and it is required to plot Q vs F for a given circuit.
Attached is the circuit.
Please let me know how to do the same.
None of my seniors or ppl who has done it earlier are here. So, I am dependent on edaboard.
Goggled and browsed edaboard, to do the same, but couldn't succeed.
In desperate need, pls help.
Thanks