Continue to Site

Welcome to EDAboard.com

Welcome to our site! EDAboard.com is an international Electronics Discussion Forum focused on EDA software, circuits, schematics, books, theory, papers, asic, pld, 8051, DSP, Network, RF, Analog Design, PCB, Service Manuals... and a whole lot more! To participate you need to register. Registration is free. Click here to register now.

How to Interpret VNA Results? (TekTronix TTR506A)

Status
Not open for further replies.

jfwork

Newbie
Joined
Apr 28, 2022
Messages
1
Helped
0
Reputation
0
Reaction score
0
Trophy points
1
Activity points
49
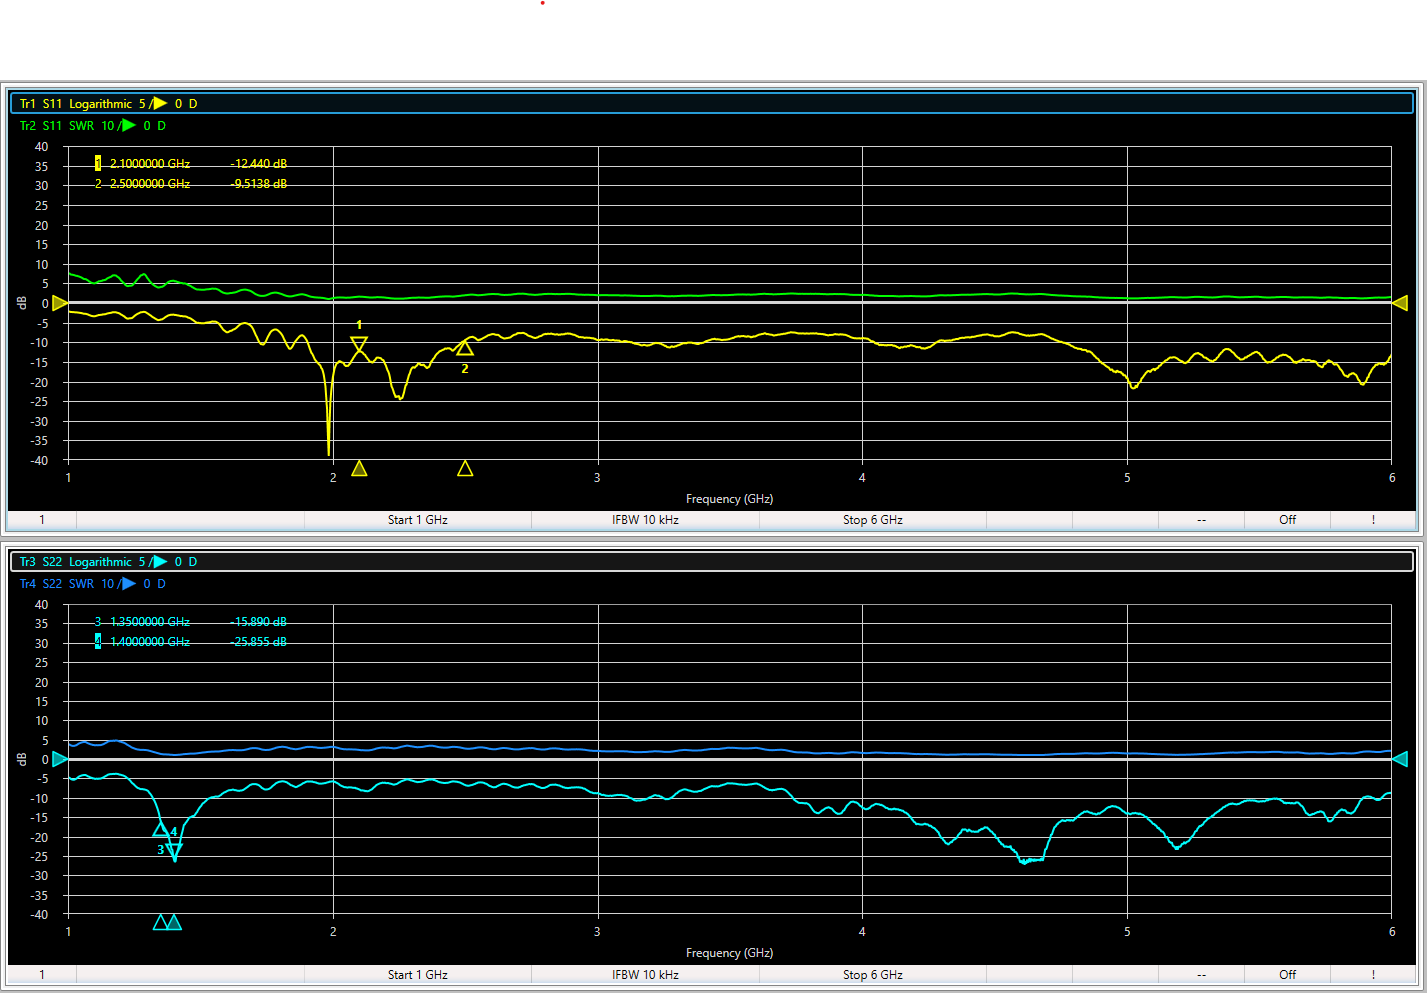
I have to utilize a VNA at work and while I'm understanding the theory better behind it, what I'm actually seeing when performing experiments doesn't match what I expect. As stated in the title, I'm using the Tektronix TTR506A VNA. I've calibrated it and I'm using a modified cal file. For example, I did an experiment with two antenna my company manufactures with differing bandwidth, the pictures are below. There are markers on at least one of the traces that show the bandwidth boundaries of the antenna. The final picture here shows the same results but with error correction on. The initial two images, error correction is off. I have each antenna hooked up to the VNA at the same time with a cable about 4 ft long. I found these antenna in a drawer (they're not brand new) and cannot say if they're damaged. But checking a second antenna that matches Antenna 1's product number, I get very similar results.
  • On Port 1: 2.1 - 2.5 GHz 2.15 dBi Omnidirectional Spring Base Antenna
  • On Port 2: 1.35 - 1.4 GHz 2.15 dBi Omnidirectional Gooseneck Antenna
To sum up what I'm expecting, I was expecting something "dramatic" and of a "singular occurence". What I mean is, I expected there to be a huge dip or huge spike along the trace at the section where the bandwidth begins and ends. I also expected there to be a singular occurence i.e., that "dip/spike" and only tha, whereas I'm seeing seemingly random results up to 6Ghz, which are similar in magnitude to what I'm seeing within the bandwidth. If what I'm saying doesnt make sense let me know. The final picture in this post is a drawing, really rough, of what I expected the traces to look like. I calibrated again and got pretty much the same results.

Examples:
  1. For S11 Log (yellow) there's a nice clean dip btwn the bandwidth markers. But then there's a dip immediately before the markers? And at around 5 GHZ, it looks sizeable
  2. For S22 Log (bright blue) there's a dip btwn the markers but then another one at around 4.5 GHz
Edit: A bandpass filter I just tried looks about how I would expect... That "dramatic", "singular occurrence" shaped similar to a square or a trapezoid. Not sure what's going on with the antenna. Maybe I'm looking at too wide of a frequency range? Like some of what I'm seeing is error that crops up irregardless of the device, at frequencies way outside it's range. But if that's the case, how do I know where to "Start"/"Stop" to collect useful, meaningful data?

S11 - LogMag, SWR.png
S22 - LogMag, SWR.png


w error correction.png
 
Last edited:

Status
Not open for further replies.

Part and Inventory Search

Welcome to EDABoard.com

Sponsor

Back
Top