Welcome to our site! EDAboard.com is an international Electronics Discussion Forum focused on EDA software, circuits, schematics, books, theory, papers, asic, pld, 8051, DSP, Network, RF, Analog Design, PCB, Service Manuals... and a whole lot more! To participate you need to register. Registration is free. Click here to register now.
Anyone know how, in either Matlab, or Matlab+Simulink, to do cascade analysis of RF chain when IIP3 and noise figure of some components is a function of frequency?
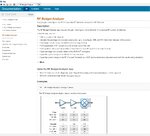
I don't know what version and what options you have available in your installed Matlab, but the link that I posted shows that Matlab has in the RF Toolbox option, the possibility to do RF Budget System Analysis including cascaded IP3 and Noise Figure analysis.
Also, there are a lot of script examples, but as a said, these are options, which you may have or don't have in your program.
Maybe I'm not conveying question clearly.
I would like to sweep an RF chain for gain, IIP3, noise figure vs. freq.
I can obviously use s-parameters to define gain as a function of frequency.
However, Is there a mechanism for specifying IIP3 and noise figure as functions of freq?
For example, TQP369185 gain block datasheet includes table which specifies IIP3 and noise figure at 9 frequencies. I would like to do a single sweep, not 9 separate simulations.
Spreadsheet is what I am using now (along with some Python helper scripts). I just keep seeing advertisements for expensive tools (Matlab, Simulink) which claim to do more than spreadsheet.
I don't want to invest $ and find out that they actually do less.
-what type of python scripts are you using?
+Normally I use spreadsheets too. If you want to calculate NF depending on frequency you need to have data of the device w.r.t frequency; some vendors provide NF data; some not. Some vendors have their own cascaded nf, IIP3 calculators; they serve more or less the same purpose. (e.g. ADISIMRF)
I wrote python script that allows me to navigate to an s-parameter file; specify frequency, row, and column; then it extracts value via interpolation; converts it to dB, then puts it in buffer so I can then just CTRL^V value into speadsheet cell. Makes it easy to populate gain values into spreadsheet given bunch of s-param files.
Problem is, I need separate column for each frequency since IIP3 and NF depend on freq which I enter manually, and of course, cascade NF and IIP3 depend in cascade gain which is in the s-params. I would like to chain together the components and have their NF and IIP3 extracted via. interpolation from a table and be able to sweep across freq rather than picking specific freqs.
I am willing to spend $ for this capability, but need to know if this is available anywhere.
Well, this is present in RF design programs such as AWR, ADS or CST. However, main problem is finding the data itself. With passive devices its easy since nf is their insertion loss. However with active devices you need to have the non-linear model or noise data of the device. If you have the data in your hand, rest is relatively easy. Check-out the program I mentioned in post #8, see if that is close to your idea.
As I mentioned, I have the data. For example the TQP369185 provides s-param file for gains, and its datasheet provides tables of IIP3 and NF vs. freq.
I have looked at ADISIMRF and it seems very limited. If your entire chain consists of ADI parts then it is easy, but how would I provide the data associated with the TQP369185? In particular, the IIP3 vs. freq table?
You mentioned that AWR,ADS, CST do this. Are you sure? I want to supply a table of IIP3 vs. freq, and have the tool sweep across freq, interpolating the IIP3 table to obtain the IIP3 value at each freq just as it interpolates s2p which is essentially also just a table of gain vs. freq. Would this table be a file is a specific format?
Well, in case of Adisim you can select a amplifier with similar characteristics to the amplifier that you have; however if you want a more direct solution yes, you need one of the RF design tools. In AWR and in ADS the thing you asked is simple. You can even have a gui for frequency selection; and the table updates each time as you scroll across the frequencies.
Can you be more specific? How is the IIP3 vs. freq table input into AWR/ADS? Is is a file of some format, or entered into GUI? If it is via GUI can you send screenshot? Or is there a manual showing this?
I'm not sure what you mean my "frequency selection". My end result I want is graph showing cascade IIP3 vs. frequency, where IIP3 of individual components depends on freq. This would be analogous to cascade gain where components have frequency dependent gain documented in their s2p files.
Going back to the original question. I am in exactly the same situation. I want to design a wide band front end and need to be able to set NF and Gain at spot frequencies across the band so that you can see the performance as you sweep the frequencies. Not manually edit each block for each frequency run
BTW the original question never changed. Just lots of non-answers. If the NF depends on freq, and the freq .vs. NF data is available in a table in the datasheet, I have not been able to determine if/how that data can be incorporated into a cascade analysis sweeping frequency.
This site uses cookies to help personalise content, tailor your experience and to keep you logged in if you register.
By continuing to use this site, you are consenting to our use of cookies.