Continue to Site

Welcome to EDAboard.com

Welcome to our site! EDAboard.com is an international Electronics Discussion Forum focused on EDA software, circuits, schematics, books, theory, papers, asic, pld, 8051, DSP, Network, RF, Analog Design, PCB, Service Manuals... and a whole lot more! To participate you need to register. Registration is free. Click here to register now.

[SOLVED] How can I get the average of several S-parameters in (Advanced Design System)ADS?

Status
Not open for further replies.

thundrous

Junior Member level 3
Joined
Oct 16, 2022
Messages
25
Helped
0
Reputation
0
Reaction score
0
Trophy points
1
Activity points
227
Hi,
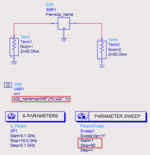
i measured 100 S2P parametres by Vector Network Analyzer (VNA), and now I want to have an average of these 100 data in ADS, What should I do? Should I define SnP parameter like below for each of them? or is there any easier way availble? any suggestion appreciated.


1676319732382.png
 

Hello,
I think your way is more difficult.
I think it's easier if you don't necessarily do it in ADS and get the average in the S2P file.
How about?
 

I don't think ADS is capable to do this. You can use perhaps MatLAB to get the average value of the s-parameters.
An appropriate script can handle this conversion.
 
Do you really want to get the average, loosing variation data that might be useful in Monte Carlo analysis?

Anyway, here is an appnote where I described two different ways to iterate over S2P files:

I think you could then use ADS data display equations on real and imaginary parts to average results per frequency, and then use function write_snp() to write out the averaged dataset.
--- Updated ---

Your task looks interesting, so I implemented an ADS workspace to do that averaging and write out an S2P file with the averaged data.

This is an extension of the workspace/appnote linked above. You first need to use one of the schematics "sweep_by_loopup_table" or "sweep_S2P_by_number" to iterate over your S2P files and create one large dataset with all of them. The actual averaging is implemented on data display "sweep_S2P_and_average", this writes out an S2P file "Smean.s2p" into the workspace data directory.

The extended workspace including averaging is attached (unzip, then unarchive the resulting 7zads in ADS)

Enjoy!
 

Attachments

  • ads_average_s2p_data.png
    ads_average_s2p_data.png
    260.9 KB · Views: 163
  • Sweep_S2P_files_and_average_wrk.zip
    87.2 KB · Views: 100
Last edited:

@volker@muehlhaus
Thank you very much for your solution. You are very good at it. One other question:
What if I have 80 separate S parameter files how can I average all of these files in ADS? Should I define a separate s2p file for all of them or is there any easier way to do that? Can I get the average of all of them in ADS and then plot the final file?

Any suggestions are appreciated.
 

Attachments

  • New folder (2).rar
    2.8 MB · Views: 84

What if I have 80 separate S parameter files how can I average all of these files in ADS?

Maybe you missed the edit/addition to my previous post. As described there, it is a two step process: you first use one of the two methods in my workspace to iterate over your 80 S2P files using ONE schematic.

Depending on your S2P names, you might prefer the number or the file list technique, which are both included in my example workspace. This creates one large dataset, and the data display will reduce that to the average and write out one averaged file.

Just take your time to look at my example workspace in the previous post, and read the appnote that I linked. It should be really straightforward with that description and example!

Edit: Your S2P are numbered, so the "sweep_S2P_by_number" schematic should be fine, if you rename your "y2 not sure.s2p" to "y2.s2p".
In schematic the filename generation is here: s2p_name = sprintf("y%i.s2p", n) will create names y1.s2p, y2.s2p etc
 

Attachments

  • sweep_number.png
    sweep_number.png
    45.6 KB · Views: 105
Last edited:

Maybe you missed the edit/addition to my previous post. As described there, it is a two step process: you first use one of the two methods in my workspace to iterate over your 80 S2P files using ONE schematic.

Depending on your S2P names, you might prefer the number or the file list technique, which are both included in my example workspace. This creates one large dataset, and the data display will reduce that to the average and write out one averaged file.

Just take your time to look at my example workspace in the previous post, and read the appnote that I linked. It should be really straightforward with that description and example!

Edit: Your S2P are numbered, so the "sweep_S2P_by_number" schematic should be fine, if you rename your "y2 not sure.s2p" to "y2.s2p".
In schematic the filename generation is here: s2p_name = sprintf("y%i.s2p", n) will create names y1.s2p, y2.s2p etc
Dear @volker@muehlhaus
Thank you very much for your help and your helpful response.
Based on your recommendation and your uploaded file in the previous comment I Used the following Scematic based on my design:
1676572139118.png


Here my new question might be look silly, but would you please tell me where should I upload my file (define the path way) so the sprintf command can load the data itself? because if I upload the file in the SNP1, it just shows the file that in browse there, and I can not find a path way in both VAR and Parameter sweep. Also SNP is defined for @s2p_name.
Again thank you very much for your response.
 

Here my new question might be look silly, but would you please tell me where should I upload my file (define the path way) so the sprintf command can load the data itself? because if I upload the file in the SNP1, it just shows the file that in browse there, and I can not find a path way in both VAR and Parameter sweep. Also SNP is defined for @s2p_name.

Sorry if my description and example was not clear.

You need to copy all your files (y1.s2p, y2.s2p, ... y80.s2p) into the data directory of that workspace, then run the simulation. When simulation is done, open data display "sweep_S2P_and_average" which averages the data and writes out the resulting S2P to the data directory.

Do NOT edit the name of the S2P data block! The schematic will sweep variable n from 1 to 80, and the sprintf() will insert that number into the y..s2p file name.
--- Updated ---

I now simplified my workspace and used your data, to see how interpolation works on your data. That workspace is attached (unzip, then unarchive the resulting 7zads).

It is necessary to have consistent filenames with no missing files in between, but your file y66.s2p was missing. I solved that by renaming y80.s2p -> y66.s2p and changing the sweep range to 1...79

Looking at the interpolated results, I am not happy with the averaged S21 values below 10 MHz. Not sure why the mean function gives a result that looks rather different from the input data there.

You might want to play around with the frequency range and sweep type in schmatic controller, I wasn't sure how your VNA calculates the step size.

Good luck!
Volker
--- Updated ---

~~~~~~~~~~~~~

Edit edit: The unexpected average in dB(S21) below 10 MHz is because your data is noisy there. Looking at the phase of your input data, it's essentially random phase, so the average of the complex data isn't the average of magnitudes.
 

Attachments

  • mean.png
    mean.png
    145.1 KB · Views: 101
  • Sweep_S2P_files_and_average_thundrous_wrk.zip
    3.5 MB · Views: 79
  • mean_dB_phase.png
    mean_dB_phase.png
    90.4 KB · Views: 99
Last edited:

Status
Not open for further replies.

Part and Inventory Search

Welcome to EDABoard.com

Sponsor

Back
Top