Continue to Site

Welcome to EDAboard.com

Welcome to our site! EDAboard.com is an international Electronics Discussion Forum focused on EDA software, circuits, schematics, books, theory, papers, asic, pld, 8051, DSP, Network, RF, Analog Design, PCB, Service Manuals... and a whole lot more! To participate you need to register. Registration is free. Click here to register now.

HFSS simulation problem

Status
Not open for further replies.

sams01

Newbie
Joined
Jun 22, 2022
Messages
2
Helped
0
Reputation
0
Reaction score
0
Trophy points
1
Activity points
34
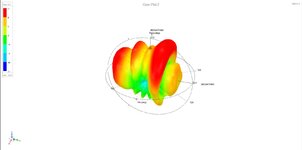
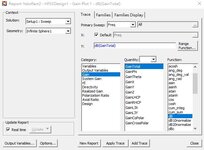
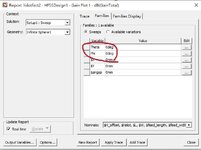
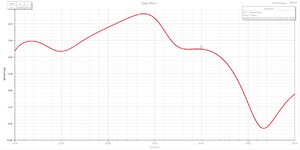
I have simulated a aperture coupled patch antenna array, but it has difference in 3D polar port and rectangular port. Why are the gain values of the two graphs different? max Gain is 9.9dB in 3D polar port, but it is different in rectangular port (center frequency:28Ghz).
 

Attachments

  • 1.jpg
    1.jpg
    57.7 KB · Views: 134
  • 2.jpg
    2.jpg
    46.6 KB · Views: 125
  • 3.jpg
    3.jpg
    40.2 KB · Views: 134
  • 4.jpg
    4.jpg
    131.2 KB · Views: 127

Welcome, sams01,

I assume by "port", you meant to say "plot". It's hard to tell from your 3D plot due to the absence of a scale, but it looks like ~2dBi gain might be correct.

There could be other issues. Is your analysis solution frequency 28 GHz? What type of sweep are you performing?
 

Welcome, sams01,

I assume by "port", you meant to say "plot". It's hard to tell from your 3D plot due to the absence of a scale, but it looks like ~2dBi gain might be correct.

There could be other issues. Is your analysis solution frequency 28 GHz? What type of sweep are you performing?
solution frequency is 28 GHz, and use the fast sweep type.
 

Alright, as far as I can tell then, the data are correct. The plots both seem to show roughly 2dB right at broadside (phi = 0, theta = 0).

It looks like the peak gain is somewhere around phi = 0, theta = 15deg.
 

Status
Not open for further replies.

Part and Inventory Search

Welcome to EDABoard.com

Sponsor

Back
Top