Continue to Site

Welcome to EDAboard.com

Welcome to our site! EDAboard.com is an international Electronics Discussion Forum focused on EDA software, circuits, schematics, books, theory, papers, asic, pld, 8051, DSP, Network, RF, Analog Design, PCB, Service Manuals... and a whole lot more! To participate you need to register. Registration is free. Click here to register now.

help:how to plot the gm*ro vs Vds curve with cadence?

Status
Not open for further replies.
sorry,but the thread does not clarify how to plot it with cadence
 

Hi afujian,

First of all you will perform a dc sweep for Vds.Then from ADE L environment you will access the top menu and find the Results Browser (Tools-->Results Browser).From there you can plot the curves gm vs. Vds and gds vs. Vds independently,where gds=1/ro.After that,you will have those plots in different waveform windows and you must open a calculator and divide them.For example,with right click and properties on a plot you will see it's name,let's say wave11 or something like that and wave30 for the other plot,then in the calculator you should right : wave11/wave30 and press plot button to see the desired result.

Before all these maybe you should create a file like that i describe in this thread https://www.edaboard.com/threads/186018/#post778216 that saves the dc operating point.

Hope the above answered your question.


Regards,
Jimito13
 

Hi jimito13,your method sounds great,but when I right click the 2 curves,there was no property choice,the attachment is the reslut.In the calculator, I write (NM0:gm)/(NM0:gds)and plot,but failed and an error message come out.so,what is wrong????

---------- Post added at 15:10 ---------- Previous post was at 15:09 ----------


Well right click maybe is not the right action..i don't remember well,but do this : double click on the 1st plot and you will see a name there,do the same for the second plot and finally divide these in the calculator.The error still exists?If yes post it with a screenshot or write the message that you see.

It would be nice to post the initial error that you encountered,maybe i can help you better if i see the error message.
 

hi jimito13,double click is the right operation,and the error message is shown in the picture,I have tried many expressions with different forms just like (gm)/(gds) or getData(gm)/getData(gds),but the error still exists!It seems that the calculator can only handle one curver one time.
 

Have you tried to create the file i suggested you above that saves the dc operating point?
 

Have you tried to create the file i suggested you above that saves the dc operating point?
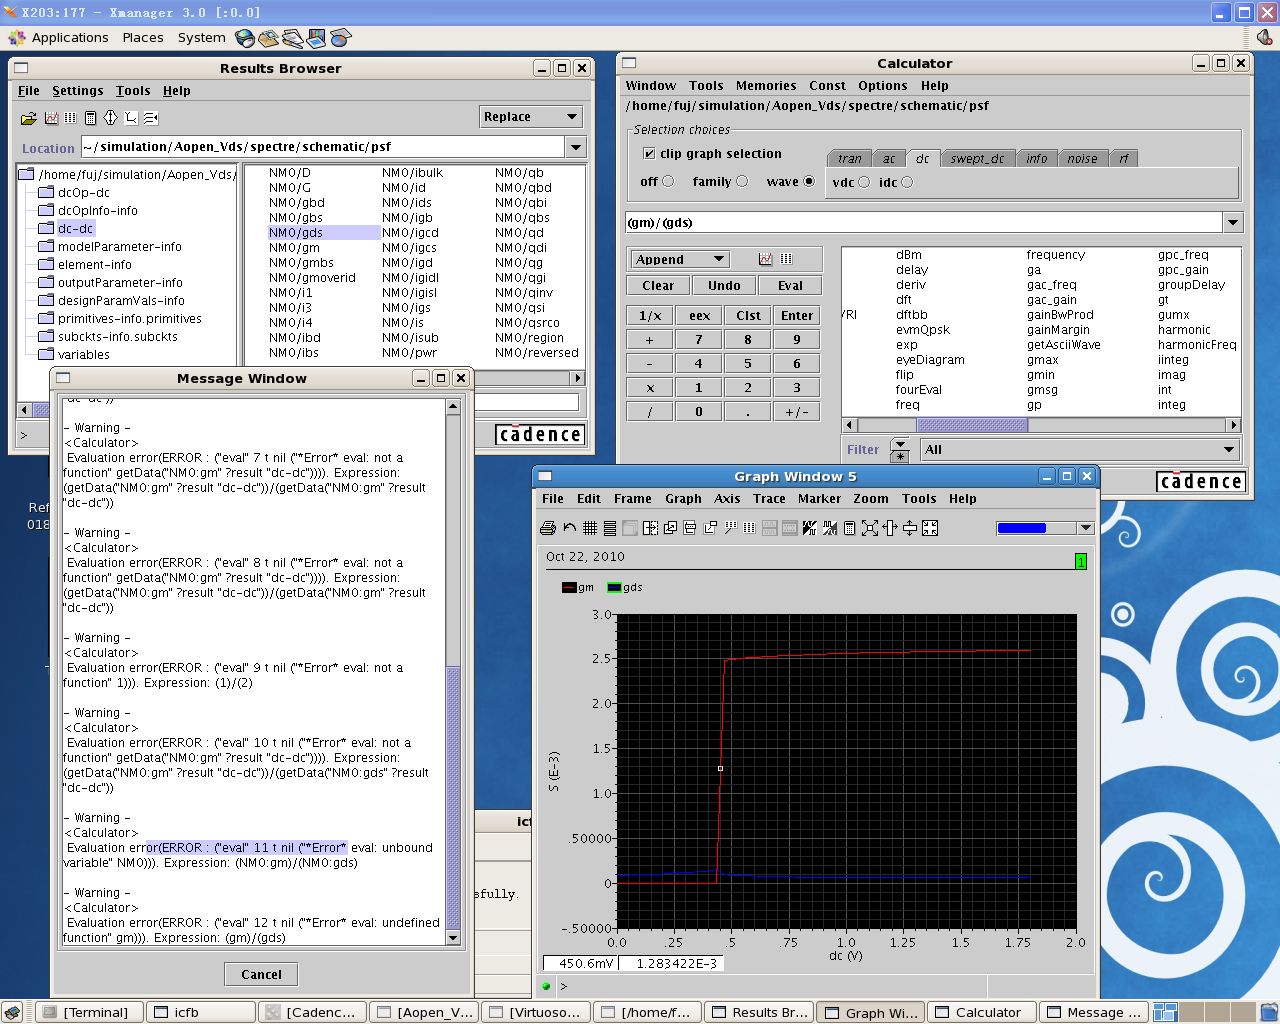
yes, of course,the dc op point is in the result browser.:-(.I write "save NM0:eek:ppoint" rather than
"save * sigtype=all" in the file,but they should have the same effect,right?
 

The syntax i proposed you saves the operating point of all components in your schematic,your syntax saves the operating point only for the NM0 component.This is the difference,but doesn't affect the expression you want to plot.Honestly i can't imagine what is going wrong with your setup...i repeat the procedure to my setup and works fine...In any case,the correct syntax for plotting this fraction is : getData("NM0:gm" ?result "dc-dc")/getData("NM0:gds" ?result "dc-dc") or
wave1/wave2 if it is available in this way from the respective plot properties.

A long time ago i had a similar problem and the cause was the transistor's naming...so try to change this name to let's say T1 and repeat the procedure.
 
Hi,jimito13,you are right,I changed the name from NM0 to N0,and then I got the answer,thank you very much!*_*
 

Status
Not open for further replies.

Part and Inventory Search

Welcome to EDABoard.com

Sponsor

Back
Top