Continue to Site

Welcome to EDAboard.com

Welcome to our site! EDAboard.com is an international Electronics Discussion Forum focused on EDA software, circuits, schematics, books, theory, papers, asic, pld, 8051, DSP, Network, RF, Analog Design, PCB, Service Manuals... and a whole lot more! To participate you need to register. Registration is free. Click here to register now.

Help for iFFT in Matlab

Status
Not open for further replies.

cmd

Member level 2
Joined
Feb 22, 2011
Messages
47
Helped
4
Reputation
8
Reaction score
4
Trophy points
1,288
Activity points
1,692
Hi everyone,

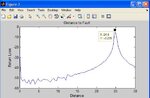
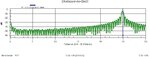
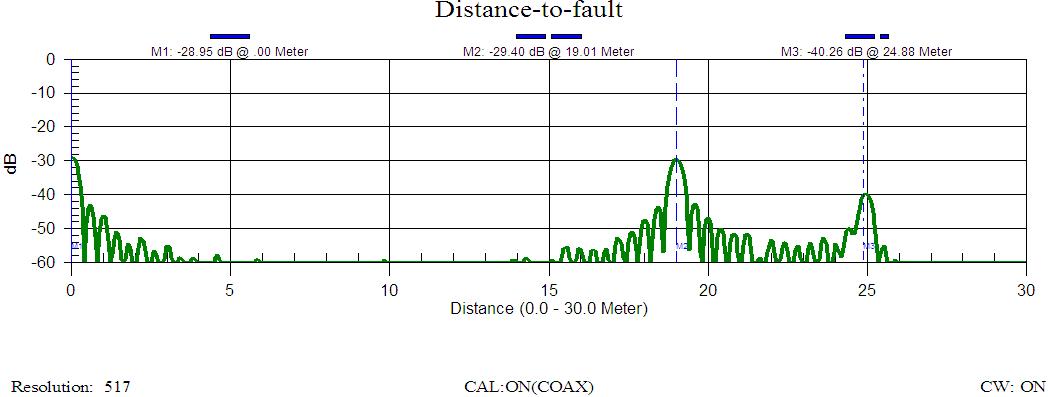
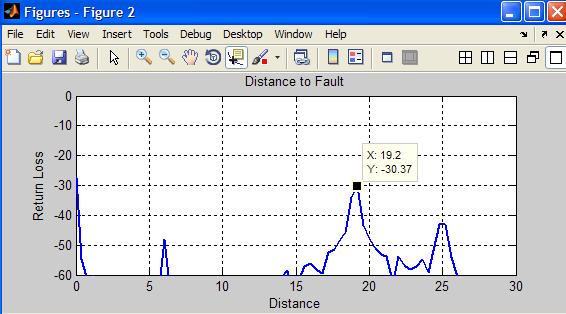
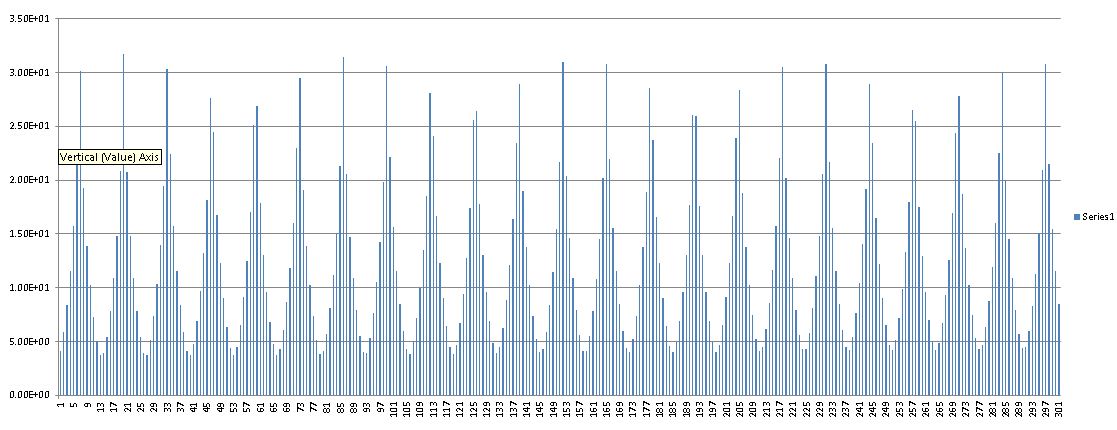
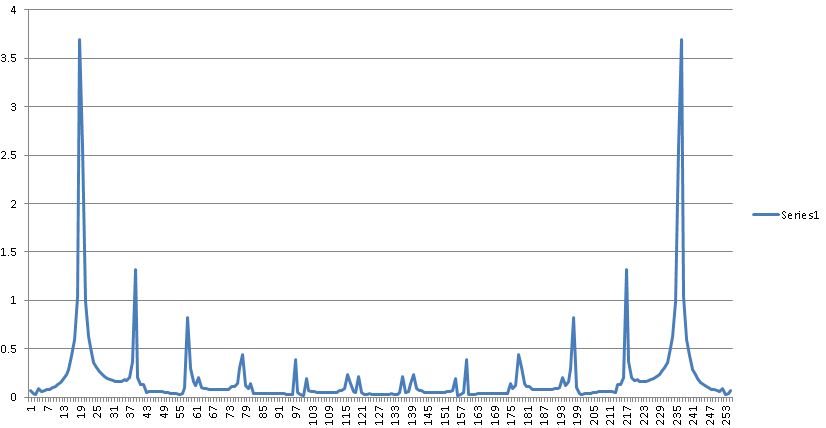
I have to make Distance to Fault measurement on cables. I have a source data from VNA return loss versus frequency. I have to transform the data into time domain with iFFT. In my data there are 301 frequency points (0.7GHz-1Ghz in 1Mhz steps) with their return loss values. How should i use iFFT function in MATLAB for this purpose?

Thanks in advance!
 
Last edited:

Is there anyone who can help me about ifft function in matlab?
I need to transform the return loss data from frequency domain to time domain in order to calculate the distance to fault on coaxial cable
 

Can you send your data file
 
  • Like
Reactions: cmd

    cmd

    Points: 2
    Helpful Answer Positive Rating
Hi klystron,
Thanks for your interest!
**broken link removed**
 

I used Excel to do the IFFT


---------- Post added at 10:23 ---------- Previous post was at 10:22 ----------

The result IFFT
 
  • Like
Reactions: cmd

    cmd

    Points: 2
    Helpful Answer Positive Rating
The Excel file
 

Attachments

  • rlos.zip
    23.7 KB · Views: 165
  • Like
Reactions: cmd

    cmd

    Points: 2
    Helpful Answer Positive Rating
I think you should convert before RL in dB into linear RL. Simply RL(lin) = 10^[RL(dB)/10]
Then you can apply IFFT. Since IFFT assumes that your data are coming from an FFT starting from negative frequency I think you should restore the central DC frequency using the fftshift command and taking only the positive times, that is windowing the IFFT vector from N/2 to N. After that you can recover the time remembering that you can go up to 1/(sampling frequency).
Now if you know the propagation speed in your medium and the velocity of light (3e8 m/s) I think you can find the distance simply multiplying time*speed.
I wrote the following code (in Scilab but I think in Matlab is exactly the same), supposing you have as input, a two column vector called "a". First column contains the frequencies and the second the RL.

datadb=a:),2);
fs = a(2,1)-a(1,1);
N = length(datadb);

c_speed = 3e8;
v_prop = 0.67;

datalin = 10^(datadb/10);

timedata = fftshift(ifft(datalin));
timedata = timedata(N/2+1:N);

time=[0:2/(N*fs):1/fs-2/(N*fs)]./2;
distance = (c_speed*v_prop).*time;

plot(distance,timedata);
 
  • Like
Reactions: cmd

    cmd

    Points: 2
    Helpful Answer Positive Rating
Thank you for your interest and reply albbg,
I tried your code in matlab i became an error for ^power:" Inputs must be a scalar and square matrix." (why do i have to transfor dm to linear?)
I commented this part and run the code. I changed v_prop=0.88 for the cables the data came from.My return loss datas are reel values. iFFT of reel value is complex in time domain. Should i take abs function? If i take it i became peakes in 20,40,60,80 which they decrease periodicly. I think that its far from expected plot. IN the expected plot, RL_time values are in negative db and at 20m a peak to (-5db)- (-10db) and at 30 m near a peak to 0 db.
 

I have done the complex impedance IFFT on the simulated data with Excel. See the attached files and the notes.
The code that you need (you must write the Matlab):
Read real impedance data from file
Read imaginary impedance from file
Make complex impedance vector ( Imp = complex(R,I))
Do IFFT (IFFT(Imp)
Scale and plot
 

Attachments

  • IFFT of complex impedance using simulated data.7z
    24.2 KB · Views: 163
  • Like
Reactions: cmd

    cmd

    Points: 2
    Helpful Answer Positive Rating
Thank you klystron! You worked really hard to help me.

I will try to do this in Matlab. Does it can be done also amplitude and phase info instead of real and imaginary part?
 

I think Matlab requires the data in the format real + i magin (The Matlab complex function will combine the real and imagin parts of the impedance
 
  • Like
Reactions: cmd

    cmd

    Points: 2
    Helpful Answer Positive Rating
Hi klystron,
I progressed my code for reel and imaginar input and also for magnitude and phase information. Here is the key part of code;
for reel and imaginer informations;
gamma_f = complex(re,img);
gamma_t = ifft(gamma_f,NFFT);
RL = 10*log(abs(gamma_t));

for magnitude and phase(angle) information;
radian = degree*pi/180;
complex= degree.*exp(i*radian);
gamma_f = complex;
gamma_t = ifft(gamma_f,NFFT);
RL = 10*log(abs(gamma_t));

But i have a different problem now. Yesterday i made some measurements with anritsu site master s311d about return los and dtf. I converted the data from site master to txt.file. But the values are with commas for ex;
700,1 -3,442 -70,7
700,6 -3,535 114,1
Matlab want numbers like belows and don't read my values with commas...
700.1 -3.442 -70.7
700.6 -3.535 114.1
How can fix this problem. Does i have to fix this with my hands :(
 

Attachments

  • 1.JPG
    1.JPG
    62.7 KB · Views: 171
  • adsız.JPG
    adsız.JPG
    27.5 KB · Views: 172
Last edited:
  • Like
Reactions: jks

    jks

    Points: 2
    Helpful Answer Positive Rating
Import the test files into Excel (comma delimited), save the xls file and use the Matlab xlsread function to read the xls file

---------- Post added at 20:44 ---------- Previous post was at 20:07 ----------

You can use csvread in Matlab to read a comma separated variable file
 
  • Like
Reactions: cmd

    cmd

    Points: 2
    Helpful Answer Positive Rating
Thanks klystron!
Problem is resolved with excel :wink:
I can locate fault at fast similar point and with fast similar rl value ,but traces look different
What do you think what could be the problem?
 

Attachments

  • adsız.JPG
    adsız.JPG
    27.5 KB · Views: 150
  • 1.JPG
    1.JPG
    62.7 KB · Views: 146

Anritsu Site Master use chirp z transform for transforming data from frequency domain to time domain in order to zoom the trace.
With ifft we create a time domain sequence with measurement points N between dt*[0:NFFT-1] and distance domain sequence until to max distance range 206meter. Then we limit the trace according to distance range we want axis([0 30 -60 0])
But if i look at data from site master it has 517 data points in 0 - 30 distance range.
It can be the reason for the difference of traces. What do you think? Do you know the way about chirp z trasform of the data?
 

Hi everyone,
There is a problem somewhere in the code. The time domain localization is true but return loss values doesn't match. In order to match return loss values i have to multiply the ifft result with a factor which changes in every experiment data. It shouldn't be so. Where is the problem?
For example in first experiment (far end of the cable is open)
I have to multiply the ifft with 2 to get true return loss values;
gamma_t = 2*ifft(gamma_f,NFFT);
So the traces is similar. I uploaded them here in last week (above)

In the second situation (cable far end terminated with load, and cable is bent in 19m)
I have to multiply the ifft with 30 to get true return loss values;
gamma_t = 30*ifft(gamma_f,NFFT);
Then the traces are more similar like below;
 
  • Like
Reactions: jks

    jks

    Points: 2
    Helpful Answer Positive Rating
i think
RL = 10*log(abs(gamma_t)); should be RL = 10*log10(abs(gamma_t));
hope this will help you

---------- Post added at 11:04 ---------- Previous post was at 11:03 ----------

i think
RL = 10*log(abs(gamma_t)); should be RL = 20*log10(abs(gamma_t));
hope this will help you
 

hi CMD
to explain you my project :
1) i have RL data Frequency and phase data separated in 401 points.
2) I need to plot IFFT from above inputs to locate fault.
3) after locating the fault in have to filter that RL value in time and
4) the filtered data in time domain is to be converted in frequency domain again.

i am unable to find the proper time scale ,
as my transmission line length is 16m and with speed of 3e8m/sec signal reaches at the end in 53nsec , but in my piloting and calculations i get the sample time as 1/400Khz and after 401 points total time is 2.5 µ sec which is much large than the actual time to reach the signal at the end.
please advice
thanks
 

Please show me your calculations for the sample frequency of 400kHz
 

Status
Not open for further replies.

Part and Inventory Search

Welcome to EDABoard.com

Sponsor

Back
Top