Continue to Site

Welcome to EDAboard.com

Welcome to our site! EDAboard.com is an international Electronics Discussion Forum focused on EDA software, circuits, schematics, books, theory, papers, asic, pld, 8051, DSP, Network, RF, Analog Design, PCB, Service Manuals... and a whole lot more! To participate you need to register. Registration is free. Click here to register now.

Extracting 2nd harmonic from signal by discrete fourier transform

Status
Not open for further replies.

Saad Muftah

Junior Member level 1
Joined
Oct 10, 2013
Messages
15
Helped
1
Reputation
2
Reaction score
1
Trophy points
3
Activity points
107
Hi

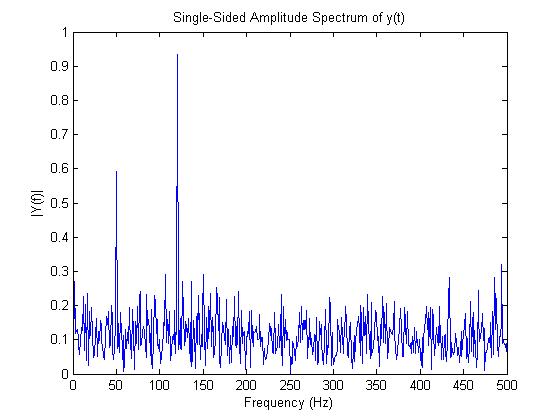
i am trying to write code to calculate 2nd harmonic from noisy signal, and i am getting stuck. Can any one help me in that.

Many Thanks,
 

Thanks for your response, your post very helpful, thanks. In fact in my research i have a noisy periodic signal, and i need let us say to keep only the second harmonic only in the signal, not all the power spectrum of all frequencies. In other word i need fft filter but it extract only one particular frequency.

I hope if you can help me

Many thaks,
 

I can suggest you firstly run the program presented on link above, due it´s the hardest part of the job.
Can you show result here ?


+++
 

8545826000_1388157734.jpg


- - - Updated - - -


From your FFT I can see two distinct frequencies: about 50 Hz and about 130 Hz. No 2nd harmonics are measurable. This doesn't mean that there aren't but they could be under the noise.
I can suggest you to acquire many time samples, then take the FFT of each time sample then sum all the FFT (the moduli). Since the noise is uncorrelated it will reduce, while the periodic signals will sum toghether (frequency by frequency). Probably plotting the log of the results instead of the linear form can help to find the harmonics at a glance.
 

    V

    Points: 2
    Helpful Answer Positive Rating
Can you explain more, or suggest an algorithm for that.

Thanks,
 

Now you acquired your signal from a given amount of time, let's say "t", then you did the FFT and plot the data (the picture you post). In order to reduce the noise with respect to the signal you could repeat the acquisition many times, then apply to each of them the FFT and finally add all the moduli of the FFT results. If you acquire M samples in time domain, if a periodic signal has amplitude A, the amplitude after the sum will be A*M, while if the noise has amplitude N, after the sum its amplitude will be N*sqrt(M).
If at present you acquired a signal for a time "t", in order to have M different acquisitions you can also acquire for time M*t, and then divide the array into M subarrays, of the same length, to which apply the FFT separately. I don't know if it's clear enough.
 
ok it is clear, but in case i need to extract particular frequency let us say 2 or 5th harmonic, how to extract it from the fft function.
 

You have to build a frequency vector. You need to know the sampling time "ts", then limiting to the positive frequency the vetor will start from 0 Hz up to 1/(2*ts) Hz (if ts is in seconds). The number of point of the frequency vector will be the same of the bins of the FFT. Now you know the relationship between each FFT element and its frequency.
 

Status
Not open for further replies.

Part and Inventory Search

Welcome to EDABoard.com

Sponsor

Back
Top