awanis
Junior Member level 1
can anybody cek my command matlab..
i want to plot X(t) signal..
ts= 0.0313
y=linspace(0,4*pi,200);
x1=6*sin(3*pi*ts);
figure(4);
plot(y,x1,'r')
hold on
x2=[5*cos(6*pi*ts)];
plot(y,x2,'g')
x3=[7*cos(8*pi*ts+(0.167*pi))];
plot(y,x3,'-')
hold off
the error is at plot(y,x1,'r')..
what should i do with the command..
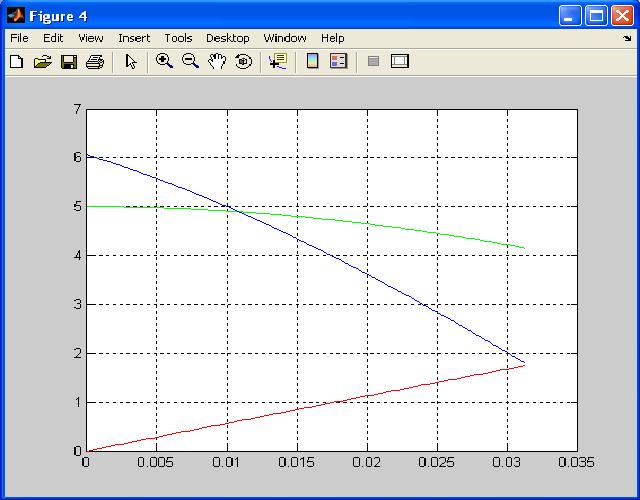
i want to plot X(t) signal..
ts= 0.0313
y=linspace(0,4*pi,200);
x1=6*sin(3*pi*ts);
figure(4);
plot(y,x1,'r')
hold on
x2=[5*cos(6*pi*ts)];
plot(y,x2,'g')
x3=[7*cos(8*pi*ts+(0.167*pi))];
plot(y,x3,'-')
hold off
the error is at plot(y,x1,'r')..
what should i do with the command..