moonnightingale
Full Member level 6
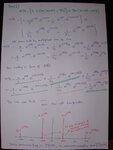
I have found the frequency spectrum of signal x=(4+cos(1000*pi*t+pi/3)).*(sin(500*pi*t+pi/4))
There is slight difference in my hand calculation amplitude and amplitude by Matlab. By me, the amplitude at 250 Hz is 2 and by Matlab it is 1.8
My solution is attached here
The matlab code is here
Fs = 2000;
t = 0:1/Fs:1-(1/Fs);
x=(4+cos(1000*pi*t+pi/3)).*(sin(500*pi*t+pi/4));
%x=(4+cos(40*pi*t)).*(cos(200*pi*t-pi/2));
%x=cos(pi*t).*(sin(10*pi*t));
xdft = (1/length(x))*fft(x);
freq = -1000 Fs/length(x)):1000-(Fs/length(x));
plot(freq,abs(fftshift(xdft)))
xlabel('Freq(Hz)-------->')
ylabel('Amplitude')
Kindly tell me abt my error
and more thing, if at two points, we have freq component, what happen to them, are they added or the lower one is merged in it
There is slight difference in my hand calculation amplitude and amplitude by Matlab. By me, the amplitude at 250 Hz is 2 and by Matlab it is 1.8
My solution is attached here
The matlab code is here
Fs = 2000;
t = 0:1/Fs:1-(1/Fs);
x=(4+cos(1000*pi*t+pi/3)).*(sin(500*pi*t+pi/4));
%x=(4+cos(40*pi*t)).*(cos(200*pi*t-pi/2));
%x=cos(pi*t).*(sin(10*pi*t));
xdft = (1/length(x))*fft(x);
freq = -1000
Fs/length(x)):1000-(Fs/length(x));plot(freq,abs(fftshift(xdft)))
xlabel('Freq(Hz)-------->')
ylabel('Amplitude')
Kindly tell me abt my error
and more thing, if at two points, we have freq component, what happen to them, are they added or the lower one is merged in it