Continue to Site

Welcome to EDAboard.com

Welcome to our site! EDAboard.com is an international Electronics Discussion Forum focused on EDA software, circuits, schematics, books, theory, papers, asic, pld, 8051, DSP, Network, RF, Analog Design, PCB, Service Manuals... and a whole lot more! To participate you need to register. Registration is free. Click here to register now.

Need guidance understanding delta sigma conveters

Status
Not open for further replies.

L.A.W.

Newbie level 6
Joined
Jun 28, 2011
Messages
14
Helped
1
Reputation
2
Reaction score
1
Trophy points
3
Activity points
0
I need some help understanding Delta Sigma data converters.

Suppose I have a 16 bit delta sigma ADC, a sampling clock at 100kHz and an oversampling ratio of 64. I want to calculate samples per second.

A 16 bit converter requires 2^N clocks; 65536 clocks in this case. If my sampling frequency is 1ookHz and the OSR is set to 64 then I am sampling at 6.4MHz.

Samples per second would be 6.4MHz/2^16 or 97.65 samples per second.

Am I correct in my thinking?
 

Samples per second would be 6.4MHz/2^16 or 97.65 samples per second.
The calculation would be right for a simple PWM DAC. SD works different. 16-Bit resolution can be achieved with lesser pulses per sample according to the SD noise-shaping characteristic.
 

The calculation would be right for a simple PWM DAC. SD works different. 16-Bit resolution can be achieved with lesser pulses per sample according to the SD noise-shaping characteristic.

Well, at least I got something right. :smile:

Then perhaps I should ask another way, because none of the literature I find clarifies it for me. I would like to know the necessary clock frequency (sampling frequency) of a delta sigma if it is 16 bits and I want 256 samples per second.
My inclination is that for every bit there needs to be a clock; so 16 bits will be 2^16 clocks, so I am trying to back calculate as in my previous post.
 

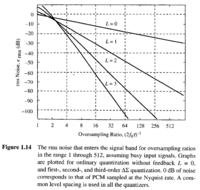
To get a rough idea how a SD-modulator changes the calculation, take a look at the inband-noise versus oversampling ratio diagram. The figure is taken from Delta-Sigma Data Converters - Theory, Design and Simulation by Norsworthy, Schreier, Temes, which would be my suggestion for further reading. The L=0 line corresponds to your calculation in post #1.

 
Status
Not open for further replies.

Part and Inventory Search

Welcome to EDABoard.com

Sponsor

Back
Top